Introduction
Spectral interferences (haemolysis, icterus, and lipemia) can significantly affect the measurements of different parameters in general chemistry. Due to the presence of high concentrations of haemoglobin, bilirubin or lipids causing these interferences, the measured values may be altered (1-3). Therefore, detecting spectral interferences and avoiding report of false results is very important in laboratories.
The most common way of detecting spectral interferences is a visual assessment of a serum sample (4). Samples with interference are identifiable through a characteristic color or turbidity. In hemolysis the sample colors light or intense red, in icterus the colors range from dark yellow to light brown or even green. Lipemic serums are usually turbid and white (milky).
The other option for detecting spectral interferences is an automated measurement of serum index which can be performed on most biochemical analyzers (4-6). Such measurements are almost urgent in laboratories with a large number of samples or laboratories using preanalytical lines where samples are not availablefor visual assessment of interferences before measurements.
The paper discusses a special feature of serum index measurements observed during our work with Siemens Dimension analyzers (Siemens HealthCare Diagnostics, Newark, DE, USA), i.e. high serum indices for lipemia in samples visually clear and transparent, showing no typical characteristics of lipemic samples. High serum indices for lipemia are unusual in such samples and probably result from the presence of some other disturbing substance and not from increased concentrations of lipids.
The Siemens Healthcare Diagnostics company, as the manufacturer of Dimension analyzers, does not have enough data yet to explain this phenomenon. Different sources from literature do not report of such cases either. The only exception is an article by the English authors Monk et al. entitled “A monoclonal protein identified by an anomalous lipaemia index”, published in 2009 (7). The article reports about a case with a high lipemic serum index identified in a sample during routine measurements on Beckman Coulter DxC800 analyzer (Beckman Coulter UK Ltd, High Wycombe, UK), whereby the serum did not have the lipemic sample appearance. With further examinations they confirmed a monoclonal IgM kappa paraprotein in the sample and the non-Hodgkin B-cell lymphoma in the patient. Other articles on monoclonal immunoglobulins (paraproteins) report of the latter as interferents in performing measurements of individual biochemical tests; however, they do not provide information regarding the effect on serum index measurements (8-12).
In this article we present our research on clarification of unusual lipemia indices on Dimension RXL Max and Dimension Vista analyzers which was performed in the years 2006-2010. We tried to determine the cause of appearance of these indices, in which patients and how often they occur, i.e. whether these indices occur occasionally or are present in specific diseases. We also tried to determine if unusual lipemia indices occur also on other biochemical analyzers.
We therefore examined the potential impact of lipids, as well as various interferents in general chemistry, like the rheumatoid factor and immunoglobulins. We compared samples with unusual lipemia index on four different analyzers – beside Dimension RXL Max and Vista also on Hitachi 910 (Roche Diagnostics GmbH, Mannheim, Germany) and former Olympus 640 (former Olympus Diagnostica GmbH, Lismeehan, Ireland; Beckman Coulter).
We present the methods of detection of unusual high lipemia indices and their characteristics as well as the results of investigations of other parameters with which we wanted to clarify their possible impact on the emergence of these indices.
Materials and methods
Measurements of serum index
HIL (haemolysis, icterus, lipemia) represents the measurement of serum index on all Dimension analyzers - RXL, RXL Max, Xpand, Xpand Plus, and Vista (13). The HIL abbreviation represents a three digit number. The first number shows the estimated effect of haemolysis, the second the effect of icterus, and the third the effect of lipemic sample on biochemical measurements (Example HIL 123: 1 is assessment of haemolysis, 2 for icterus, 3 for lipemia). Dimension Vista analyzer is an exception. The measuring principle is the same as on other analyzers, however, the assessments of all three interferences are expressed as individual figures.Interference value is expressed in numbers from 1 to 8 on Dimension Vista analyzer and from 1 to 6 on other Dimension analyzers. The interference effect on biochemical measurements increases with ascending numbers: number 1 indicates a usual sample without interferences (HIL 111: no haemolysis in sample, no icterus, no lipemia), the number 6 or 8 indicates the highest possible interference in a sample (e.g.: HIL 666 – strong haemolysis in sample, sample highly icteric and lipemic).
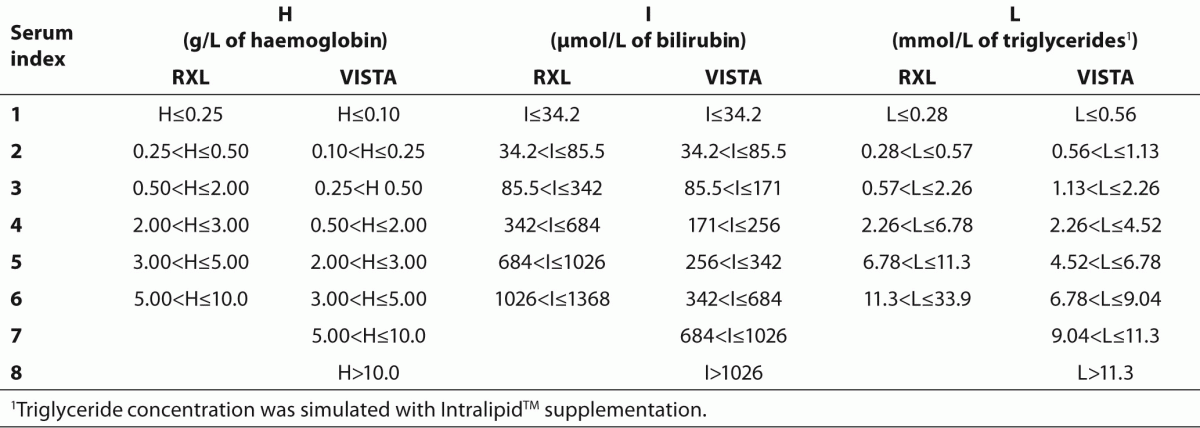
Serum index measurements are performed simultaneously with routine measurements of other examinations on a sample. The analyzer dilutes a small volume of sample (RXL Max 20 µL, Vista 10 µL) with water and measures absorbance at individual wavelengths defined for each spectral interference (Table 1). The measured absorbencies are converted by means of mathematical formulas into concentrations of haemoglobin, bilirubin or triglycerides and these are further categorized with numbers from 1 to 6 or 8 marking the presence of interference (Table 2). The decision whether interference has a significant impact on the measured results of biochemical examinations is made by comparing the measured serum index with the set, i.e. critical values, defined on the basis of validation by Siemens company. When the measured serum index in a sample is the same or higher than the defined critical index value, the measured results are impacted by the interferences.
Table 1. Haemolysis, icterus and lipemia measurement wavelengths on Siemens Dimension, Roche Hitachi and former Olympus analyzers.
Table 2. Concentrations of haemoglobin, bilirubin and triglycerides with appropriate serum indices for RXL Max and Vista analysers, provided by Siemens Healthcare Diagnostics.
The method of measuring serum indices on different biochemical analyzers differs to a certain extent. Different equipment manufacturers have validated somewhat different systems of index measuring, although the principle is similar; the serum sample is diluted with water or water diluent, absorbance of haemoglobin, bilirubin and lipids is measured at different wavelengths, and different mathematical conversions of the measured absorbance into concentrations are used (6,14). The display of the measured serum index also varies on different analysers (e.g. HIL factors from 1-6 or 8 / Siemens; categories “N, 1+ to 5+” / former Olympus AU 640; numerical value in units of icterus, haemolysis and lipemia / Roche Hitachi 911).
Sample and test selection
We performed routine biochemical measurements on Siemens Dimension RXL Max analyzers (former Dade Behring) from September 2006 until June 2010, and on Dimension Vista analyzers from June 2010 on.
Samples, which were routinely tested on our biochemical analyzers and for which a warning was issued in LIS for potential impact of lipemia on the results, were checked and visual assessment was provided. From September 2006 until December 2010 we thus discovered 202 different patients with extremely high lipemic index whereby the serum samples were clear or without signs of lipemia. The majority of 202 patients were treated at the Department for Haematology (96), Department for Gastroenterology (31), Emergency Unit (27), Department for Rheumatology (16), Department for Infectious diseases (9), and elsewhere (23).
As these patients received either outpatient treatment due to first aid or control check-ups, or were hospitalized at different departments, we received for each of these patients a different number of samples – either one single sample, a series of samples at check-ups, or even a series of everyday samples consecutively in hospitalized patients.
We considered all indices for lipemia, which were equal to or higher than 4 as unusual high lipemia index (in a clear serum sample); values 4, 5 or 6 on RXL Max analyzer and values from 4 to 8 on the Vista analyzer. Index 4 is defined as the minimum concentration of 2.26 mmol/L of triglycerides on both instruments. We set index 4 as a threshold value because at this stage we did not expect any clear or only slightly cloudy samples any more.
The samples were processed according to the following algorithm:
1)In 202 different samples (of all patients with unusual serum index for lipemia), regardless of the department they were treated at, we performed simultaneously additional examinations. Regarding the increased serum index for lipemia, we measured lipid concentration in samples (total cholesterol, triglycerides, HDL, LDL, Lp(a), ApoA1, ApoB) and examined their potential impact on appearing of unusual lipemia indices by comparison with a control group of 50 samples. The control group was constituted of 50 randomly selected samples with established monoclonal peak in serum protein electrophoresis and with a normal serum index HIL 111. In the selected 202 different samples of patients with unusual serum index for lipemia we checked also for other possible interferences – concentration of rheumatoid factor (RF), immunoglobulins (IgG, IgA, IgM, kappa and lambda light chains), and the concentration of total proteins. We performed serum protein electrophoresis and immunoelectrophoresis. When the sample volume was insufficient for the mentioned examinations, we requested for an additional blood sample. Examinations on this sample were performed only if additional blood was taken within 2 hours and the serum index in the sample was the same.
2)We determined the repeatability of indices by measuring serum index in 40 samples of different patients 5 times on the first day after the sample arrived to the laboratory. All measurements were done on Dimension RXL Max analyzer. Samples were selected at random, but only from those patients, where unusual high lipemia index already appeared and where we included a preliminary sample of the patient to additional examinations in the first paragraph.
3)Day-to-day and long-term repeatability were determined by measurements of serum index in 98 samples of different patients on the first day after the sample arrived to the laboratory and after a certain period of time: (1) 1 sample aliquot was stored at 2-8 °C and serum index measured 5 days consecutively. (2) 1 sample aliquot was stored at -20 °C and serum index measured after 3 months. (3) 1 sample aliquot was stored at -20 °C and serum index measured after 12 months. All measurements were done on Dimension RXL Max analyzer. Like before, samples were selected at random, but only from those patients, where unusual high lipemia index already appeared and where we included a preliminary sample of the patient to additional examinations in the first paragraph.
4)We compared lipemia indices on different analyzers by measuring 42 samples of different patients on RXL Max, Vista, Hitachi 911 and former Olympus AU640 analyzers. Measurements were performed within 4 hours after the sample arrived to the laboratory. Again, samples were selected at random, but only from those patients, where unusual high lipemia index already appeared and where we included a preliminary sample of the patient to additional examinations in the first paragraph.
5)During a 3-month period from February to April 2008 we daily checked all samples where we performed serum protein electrophoresis. In 79 samples with established monoclonal peak we checked or measured the lipemia index on the same day of sample arrival to the laboratory on Dimension RXL Max analyzer.
6)By data research of preliminary test reports we tried to find eventually routinely measured concentrations of cryoglobulins in patients with unusual lipemic serum index. We have not performed these measurements simultaneously as an additional test (like other tests in paragraph 1) because the blood sample for analysis needs to be (as a result of cryoglobulin precipitation) transferred to the laboratory immediately at 37 °C.
7)By analyzing the data, we also attempted to determine the incidence of unusual high serum indices for lipemia and tried to acquire the respective diagnoses of patients.
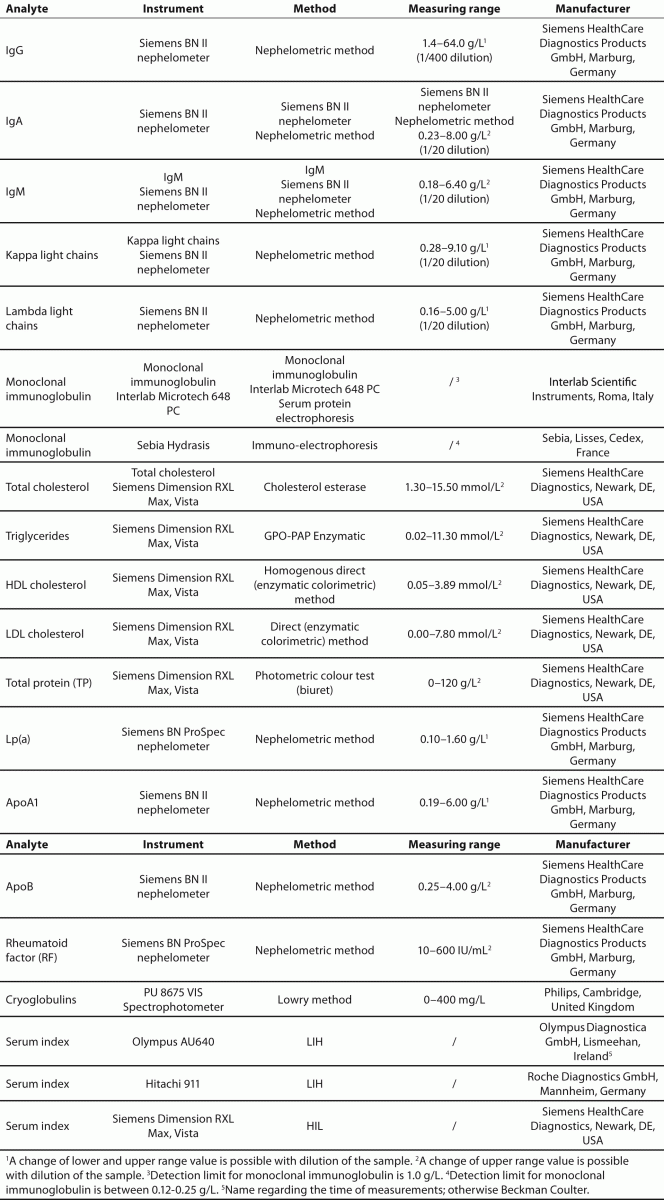
Serum samples were used for all analyses. Samples were drawn into BD Vacutainer® SSTTM II Advance tubes (Becton Dickinson, Plymouth, United Kingdom), and centrifugated 10 minutes at 1990 x g. Cryoglobulin measurements were performed in BD Vacutainer® CAT tubes (Becton Dickinson, Plymouth, United Kingdom), brought to the laboratory immediately in warm water and centrifugated 10 minutes at 1990 x g. All measurements were conducted on the analyzers and methods listed in Table 3.
Table 3. Parameters that were measured to evaluate their impact on the occurrence of high serum indices in clear serum samples; methods, measuring ranges, instruments and reagent manufacturers.
Statistical analysis
The Kolmogorov-Smirnov test was used to assess the normality of distribution of investigated parameters. Results were expressed as mean ± standard deviation for normal distribution and as median with interquartile range if the distribution was not normal (15). Age was expressed as median (minimum-maximum age). Differences were tested by two-tailed t-test for independent samples with normal distribution and by non-parametric tests for other data; Mann-Whitney U-test for independent samples which did not follow normal distribution, two-tailed Pearson chi-square test for nominal values, Friedman's test and Wilcoxon signed rank test for repeatability of serum indices. The values P < 0.05 were considered statistically significant. Statistical analysis was done using IBM® SPSS® Statistics version 19.0 (SPSS Inc., New York, USA).
Results
In the years 2006-2010 we have discovered 202 different patients with markedly elevated serum lipemia index and a clear serum sample. 109 patients were measured on RXL Max analyzer with indices 4, 5 or 6 and the remaining 93 patients on Vista analyzer with indices from 4 to 8 (Table 4). There were slightly more women than men (Table 4). 79% of all lipemia indices were in class 4 and 14% in class 5. The proportion of other lipemia indices was very small (3% for lipemia index 6, 2% for index 7 and 2% for index 8).
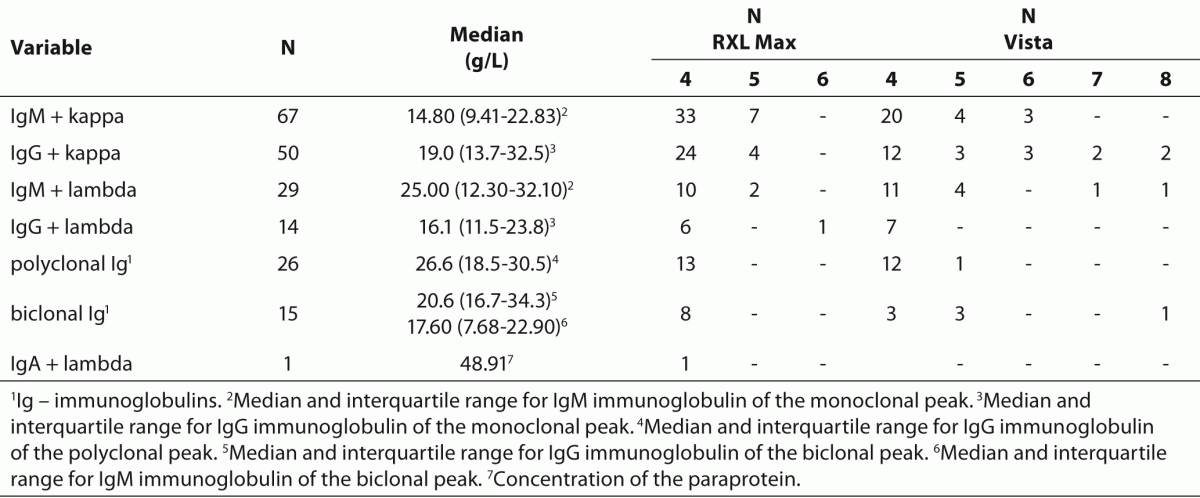
In 176 of 202 samples (87% of samples) we detected a monoclonal or biclonal peak with serum protein electrophoresis; in the remaining 26 samples (13%) we found polyclonal elevated concentrations of immunoglobulins (Table 5). The most common types of paraproteins set by immunoelectrophoresis were IgM + kappa and IgG + kappa.
Table 4. Number of patients with lipemia index from 4 to 6 (RXL Max) or from 4 to 8 (Vista) and a clear serum; sex and age of patients.
Table 5. Total number of samples with individual (monoclonal, biclonal or polyclonal) immunoglobulins and median concentration of relevant immunoglobulins (IgG, IgM, IgA); number of samples according to the lipemia index.
The median concentration of IgG in all samples with IgG paraprotein (IgG + kappa, IgG + lambda, IgG in biclonal peak) was 18.8 (13.6-32.1) g/L, regardless of the measured lipemia index ranging from 4 to 8. The median IgM concentration in all samples with IgM paraprotein (IgM + kappa, IgM + lambda, IgM in biclonal peak) was 16.45 (9.70-28.58) g/L, regardless of the measured lipemia index in the range 4-8.
Unusual high lipemia indices did not occur in all samples with a monoclonal or biclonal peak. From 79 samples with the established paraprotein and a clear serum found during a 3-month period at our laboratory, only 20 (25%) had a lipemia index 4 or more.
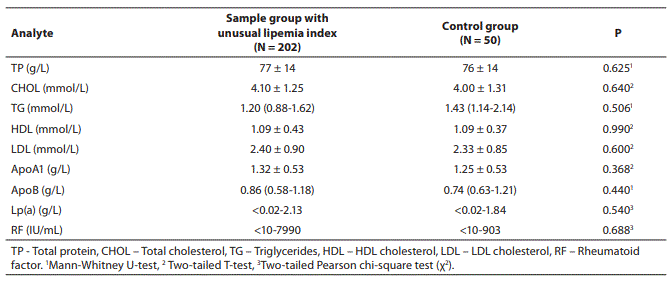
We found no statistically significant differences in mean or median concentrations of other tested analytes between samples with unusual lipemia index and the control group (Table 6).
Table 6. Mean and median concentration values for individual tests that were performed to determine their impact on the phenomenon of high serum indices for lipemia in clear serum samples; values for 202 samples with unusual high lipemia index in a clear serum and values for the control group.
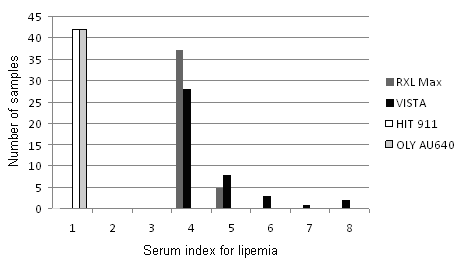
Due to different classification of serum indices in 6 or 8 concentration classes, the measured values on RXL Max and Vista analyzers were not entirely comparable (Figure 1). Mean lipemia index in 42 samples from different patients was 4.1 on RXL Max and 4.6 on Vista. All measured values on Olympus AU640 and Hitachi 911 were normal (“N” on Olympus) or very low (the highest value “21” or 0.24 mmol/L of triglycerides on Hitachi 911). The measured values on both instruments fell into class 1 according to Siemens classification of serum indices.
Figure 1. Measurements of lipemia index in 42 samples of different patients with unusual high lipemia index on RXL Max, Vista, Hitachi 911 and former Olympus AU640 analyzers.
Five successive repetitions of serum index measurements in 40 samples of different patients indicated a good repeatability; no significant differences were found between indices with Friedman's test (P = 0.637) and with Wilcoxon signed rank test when compared to the first measurement (P values > 0.157). 154 of 160 repetitions had the same lipemia index as the first measurement. Only 6 of 160 measurements (3.75%) had a lower lipemia index by 1 class.
Unusual high lipemia indices in 98 samples from different patients were not stable for long. We found significant differences with Friedman's test (P < 0.001) and with Wilcoxon signed rank test in comparing the measurements of each day, after 3 months, and after 12 months with the measurements on the first day. The lipemia indices gradually lowered from one day to the next in most of the samples. Mean lipemia index was 4.2 on the first day of measurement and 3.6, 3.3, 2.9, and 2.5 in the days following. Mean value after 3 months was 2.7 and 1.9 after one year.
In 5-day measurements from specimens stored at 2-8 °C in a refrigerator the lipemia index normalised (L = 1) in 5 samples already on the second day of the measurements. After five days the same lipemia index retained only in 9 samples. In these 9 samples various types of monoclonal immunoglobulins were present (IgG + kappa, IgM + kappa, IgM + lambda, biclonal IgM + kapa, lambda).
In measurements of frozen aliquots at -20 °C after 3 and 12 months, only 14 samples had the same index after 3 months of storage as the first day of measurements and only 5 samples after 12 months of storage. In these 5 samples IgM + kappa or IgM + lambda paraprotein was present.
By data research we found results of cryoglobulin measurements in test reports of 12 out of 202 patients with unusual high lipemia index. In these test reports the concentration of cryoglobulins was reported to be above the reference value. Serum protein electrophoresis was also given in the same reports; in 3 out of 12 test reports a monoclonal peak was identified. In the remaining 190 patients with unusual high lipemia indices cryoglobulin measurements were not reported.
At the time of our research (2006–2010), we measured about 1.170,000 serum samples on RXL Max and Vista analyzers. Serum indices were measured in most of them, with the exception of neonatal and some pediatric samples. During this time we have discovered unusual high lipemia index in 1240 samples, which represented 0.1% of all sample framework. These 1240 samples represent repeated blood samples from 202 discovered patients with unusual high lipemia index included in our study. The repeated blood samples were due to control check-ups or even series of everyday samples consecutively in hospitalized patients.
For 78 patients, we managed to obtain a reliable diagnosis. Unusual high lipemia indices were seen mostly in patients with multiple myeloma (24), Waldenström's macroglobulinemia (11) and other lymphomas (8), leukemia (9), liver cirrhosis (9), cancer (7), MGUS (Monoclonal gammopathy of undetermined significance) (4), diabetes (4), and Sjögren syndrome (2).
Discussion
Markedly elevated lipemia index is usually a consequence of a highly lipemic or turbidic sample. Appearance of such index in a clear serum is unusual, unless interference is present (7).
In measurements of serum index on Siemens Dimension analyses we found high lipemia indices as a consequence of immunoglobulins present in the sample. In 87% of 202 samples we discovered a monoclonal or biclonal peak in serum protein electrophoresis. In the remaining 13% of samples policlonal elevated immunoglobulin concentrations were present. Other parameters which we measured to view their impact on unusual high lipemia index had no influence on appearing of these signals.
According to our work (1) the single occurrence of unusual high lipemia index does not indicate a reliable presence of a paraprotein in the sample; such indices occurred in a small proportion also in samples without a monoclonal peak. (2) Unusual high lipemia index is not typical for all samples with a paraprotein; in our research it has appeared only in 25% of all samples with a monoclonal peak found at our laboratory. (3) The appearance of this index and its size are not related to the presence of a certain type of paraprotein or its concentration range; for samples with a monoclonal peak we have demonstrated various types of paraproteins with different concentrations.
According to our work, any high lipemia index in a clear serum on Dimension instruments represents a great probability for paraprotein presence in the sample. In this respect, class 4 of the lipemia index, as a limit value at which we started verifying the presence of monoclonal peak, proved to be reasonable for both instruments.
With our research we were not able to determine why we perceived unusual high lipemia indices in limited samples (with paraproteins). As a reaction of determining unusual high lipemia index a precipitation of immunoglobulins probably takes place, which causes enhanced turbidity of the sample (16). Immunoglobulins, which are normally present in a serum sample, do not cause this reaction, as well as not all paraproteins. We presume major immunoglobulin complexes appear in samples with unusual high lipemia indices that may decompose or precipitate over time, thereby causing an unusual lipemia index. This presumption is based, in addition to the already mentioned three findings, on the following: (1) Unusual high lipemia indices have not been stable for a long time. The size of the indices is decreasing with time. In some samples, the index fully normalized already after a few hours of storage at 2-8 °C. Only in rare cases the indices remained unaffected, either for a few days at a temperature of 2-8 °C or up to 1 year, frozen at-20 °C. (2) In 12 patients with unusual high lipemia indices we found results of cryoglobulin measurements with data research. All results were above the reference value. Monoclonal peak was present only in 3 out of 12 patients. Unfortunately, in the remaining 190 patients with unusual high lipemia indices cryoglobulin measurements were not reported.
Since we assume the presence of immune complexes in clear samples with unusual high lipemia index, we agree with the assumptions of Monk et al. that increased lipemia indices are probably not caused by the paraprotein itself, but with the precipitation of cryoglobulins (or other immune-complexes) under certain conditions (7).
Likewise, we could not answer why we perceived unusual high lipemia indices only on certain biochemical analyzers. We believe the normal lipaemia index on Roche Hitachi and former Olympus instruments in the same samples might be due to a diverse way of measuring serum indices. It is not clear yet what the decisive difference is. These instruments use different solutions for sample dilution (water on RXL Max and Vista instruments, 0.9% NaCl on Roche Hitachi and former Olympus instruments, according to the English authors Monk et al. Tris-HCl buffer with pH = 7.6 on Beckman Coulter DxC800 instrument), different proportions of human serum sample and diluent, different wavelengths at which the interferences are measured, and different mathematical equations for transforming absorbencies into a concentration of interfering substances (6,13,14).
Despite a number of open questions that remain regarding the cause of the occurrence of unusual lipemia indices, an important conclusion is that they occur in a large proportion of haematological diseases, like multiple myeloma, lymphoma, leukemia, and even MGUS. The information of a possible presence of a monoclonal gammopathy can be of high importance in undiagnosed patients.
Conclusions
Markedly elevated lipemia index in a clear serum, measured on Siemens analyzers Dimension RXL Max and Dimension Vista, indicates a high probability of a paraprotein presence in the sample. The size of the index alone does not imply the type of the paraprotein or his concentration range. The information of an unusual high lipemia index can be important because it suggests the possibility of the presence of serious haematological disease.

