Introduction
Chronic kidney disease (CKD) inevitably leads to dialysis if the patient does not receive a renal transplant. Unfortunately, dialysis patients have a profound co-morbidity including bone disease attributable to hypocalcaemia, hyperphosphataemia, low levels of serum dihydroxy-cholecalciferol and secondary hyperparathyroidism (1). Chronic kidney disease-mineral and bone disorder (CKD-MBD) is furthermore likely to be aggravated by a history of glucocorticoid treatment as used in glomerulonephritis and after renal transplantation (2). Indeed, the incidence of femoral neck fractures is increased approximately four-fold in patients on dialysis compared with a general population (3), while the incidence of vertebral fractures may not be increased (4). Fracture is a significant cause of morbidity and mortality (5), and the incidence of fractures is also increasing with the increasing average age of dialysis patients.
Bone mineral density (BMD) as measured by dual-energy X-ray absorptiometry (DXA) relates to fracture risk in subjects with normal renal function (6), in patients with CKD (7) and patients on haemodialysis (8,9), although not evident from all studies or in all patient populations (10). Previous studies have reported decreased BMD in patients on dialysis (11-13), but although BMD measurements have been found useful for screening or assessing fractures (6) only few larger longitudinal studies are available on dialysis patients (14,15). The pattern of bone loss may be changing with the quality and duration of dialysis treatment and the age of the dialysis population. Of note, differences regarding bone loss may exist between patients on chronic haemodialysis (HD), usually performed four hours three times weekly, and peritoneal dialysis (PD), which may be continuous or performed every night, usually with a lower capacity to eliminate uremic waste products than HD. However, only one study has addressed this issue thoroughly (16).
Assessment of bone turnover markers (BTMs) has lately been recommended for CKD patients and dialysis patients (17). The recommended BTMs include total alkaline phosphatases (t-ALP) and bone-specific alkaline phosphatases (b-ALP), which in combination with serum parathyroid hormone (PTH) have been found useful for assessment of bone loss (15,18). Recently, a study of these BTM in HD patients could not confirm the use of b-ALP in patients with concomitant liver disease (19). The aim of the present study was to compare BMD of the femoral neck, forearm and spine in patients on HD and PD, respectively, and to identify BTMs in both type of dialysis patients.
Materials and methods
Patient inclusion
This study was conducted from November 1999 until February 2001 as part of a single-centre study of dialysis patients at Odense University Hospital, where some preliminary data previously has been reported (20). Participants were selected from the cohort of HD or PD dialysis patients routinely treated on Department of Nephrology and were included if they were > 18 years. As part of a clinical routine patients were physically examined and routine blood sampling was performed to adjust treatment and check for co-morbidity. Patients with known severe diseases such as cancer, bone-metabolic disease or liver affection were excluded by judgement of the attending physician. A total of 174 patients, 146 on HD and 28 on PD, entered the study. They had all regular DXA scans as part of their routine care. None of the patients had any known history of fractures. All female dialysis patients had amenorrhea. Data was retrieved on primary renal disease, age at start of dialysis, dialysis duration, dialysis dose, previous renal transplantation, and glucocorticoid treatment ever. For a period, yearly DXA was intended as part of the clinical routine and for 66 HD patients and 7 PD patients, follow-up DXA was performed after a mean period of 14 ± 3 months (range 9-23 months). The large percentage of drop-out in the follow-up was due to the high mortality in this patient group and also, some patients received a renal transplant in the period and were therefore excluded.
Dialysis
Dialysis dose was calculated as Kt/V: (dialyzer clearance of urea x dialysis time)/patient total body water. According to the Kidney Disease Outcomes Quality Initiative (K/DOQI) Kt/V is given per week for PD patients and per session for HD patients (21). All patients had 1.25 mmol/L calcium in their dialysate and none of them received bisphosphonates.
Bone mineral density measurement
BMD was measured in the femoral neck, lumbar spine (L1-L4) and distal forearm (the non-shunt arm) by DXA using a Hologic QDR-2000 (pencil-beam mode) or Hologic QRD-1000 scanner (both from Hologic, Waltham, MA, USA). The comparability of results obtained from these two different types of scanners was investigated using a phantom and the variance was found insignificant (coefficient of variation < 0.5%). For comparison of BMD in the forearm, normative data provided by the DXA manufacturer were used. Due to lack of normative data from the manufacturer on BMD in the spine and femoral neck, a control group of 291 self-reported healthy Caucasian subjects (110 males and 181 females) aged 19-79 years was used. This control group has previously been described in detail (22), but of special interest persons were excluded in case of metabolic bone disease including non-traumatic fractures, abnormal renal function (i.e. plasma creatinine values over the age- and gender-specific reference ranges recommended by the Scandinavian Society for Clinical Chemistry (23)), current or past malignancy, and furthermore, current or past treatment with glucocorticoids, bisphosphonates, or calcitonin ruled out participation.
Biochemical analyses
A total of two tubes (a total of 40 mL) (BD Diagnostics, Plymouth, England) were drawn from each patient before dialysis in a fasting state within a week of the DXA scan. All analyses were performed immediately after sampling. For measurement of plasma phosphate, plasma albumin, and t-ALP lithium heparin tubes were used, and samples were spun for 7 minutes at 2000 x g. The analyses were performed on a Modular equipment (Roche Diagnostics, Basel, Switzerland) with dedicated reagents applied as recommended by the supplier. Isotype determination of alkaline phosphatases was not performed. For analysis of ionised calcium, PTH and 25-hydroxy vitamin-D blood was collected in tubes without additives, were left to clot for 1 hour and then spun as described above. Measurement of ionised calcium was performed on an ABL 735 instrument (Radiometer, Broenshoj, Denmark), while PTH analysis was measured with an electrochemiluminescence immunoassay (ECLIA) on Immulite 2000 (Siemens, Munich, Germany), using polyclonal AP-labelled capturing antibody (1-34) and a monoclonal detecting antibody (44-84). Intra- and inter-assay coefficient of variation (CV) for the PTH analysis was 2.5% and 5.8%, respectively (manufacturer’s information). Finally, 25-hydroxy vitamin-D was measured by enzyme immunoassay (IDS, Phoenix, AZ, USA) with an intra- and inter-assay CV of 5-7% (at 39-165 nmol/L) and 5-9% (at 40-132 nmol/L), respectively.
Statistical analyses
To investigate whether BMD was lower in dialysis patients than in a general population, Z-scores were calculated, as they are a more appropriate parameter than BMD values or T-scores. BMD was transformed into Z-scores using the formula:
Z-score = (observed BMD - mean BMD for age- and sex-matched healthy subjects) / SD for age- and sex-matched healthy subjects.
Changes in BMD were expressed as the annual percentage change calculated by the formula:
((BMD2-BMD1)/BMD2) x 100 / (time2-time1).
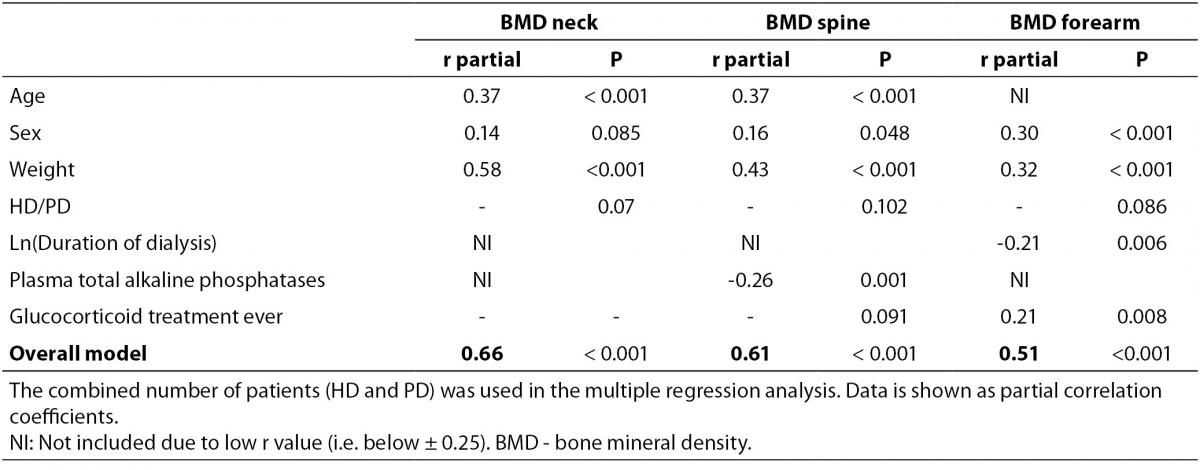
Normality was checked by inspection of scatter plots and the use of probit plots. Age was normally distributed, while PTH and duration of dialysis were log-normally distributed and non-parametrical statistics was therefore used for these parameters. Also, variance between groups was investigated using Levene’s test, which did not indicate significant differences. Co-linearity was checked using the SPSS procedure for multiple regression and in all cases tolerance was above 0.20. Differences between groups were compared using Mann-Whitney or Chi-square test as appropriate. The relationship between all parameters was investigated in a bivariate analysis using Pearson’s correlation. For multiple regression analysis we chose to enter variables with well-documented relationship with BMD (i.e. age, sex and weight), added by variables that may be modifiable or related to treatment (i.e. duration of dialysis) and finally variables potentially confounding the correlation (bone turnover). The model was built by entering age, sex, weight, dialysis type (HD/PD), duration of dialysis (ln-transformed), PTH (ln-transformed), t-ALP and glucocorticoids ever (yes/no); parameters were however only used if the r value in our bivariate analysis exceeded 0.25 for the specific BMD investigation (i.e. femoral neck, lumbar spine or forearm). P-values < 0.05 were considered significant. No corrections for multiple comparisons were made. Data are shown as median (first quartile-third quartile) unless otherwise stated. Statistical analyses were performed using SPSS ver. 17.0 (SPSS Inc, Chicago, IL, USA).
Results
Cross-sectional study
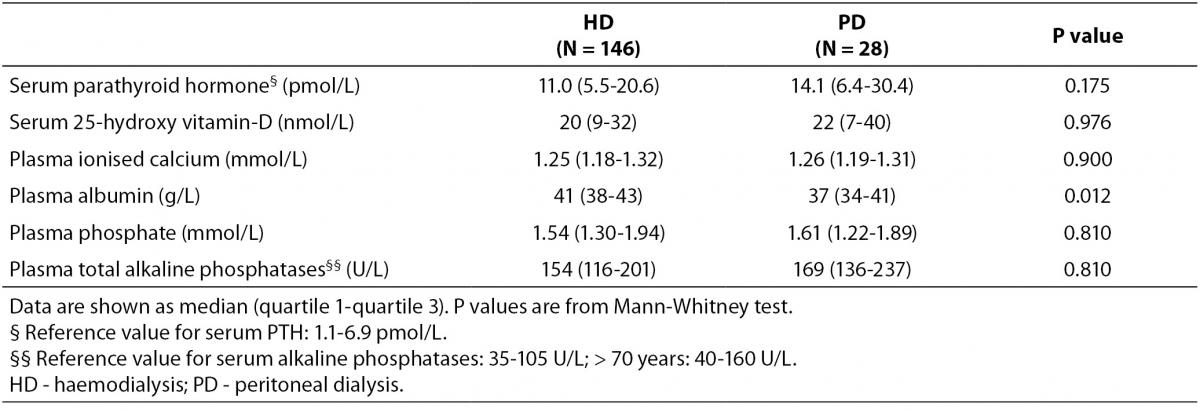
Baseline characteristics of patients and controls are shown in Table 1, while bone turnover markers are shown in Table 2. There was a higher percentage of male participants in the PD group than in the HD group (P = 0.031), and the participants in the PD group were significantly taller than those in the HD group (P = 0.007). PD patients also had alower plasma albumin compared with patients on HD (P = 0.012).
Table 1. Baseline characteristics of individuals included in the study.
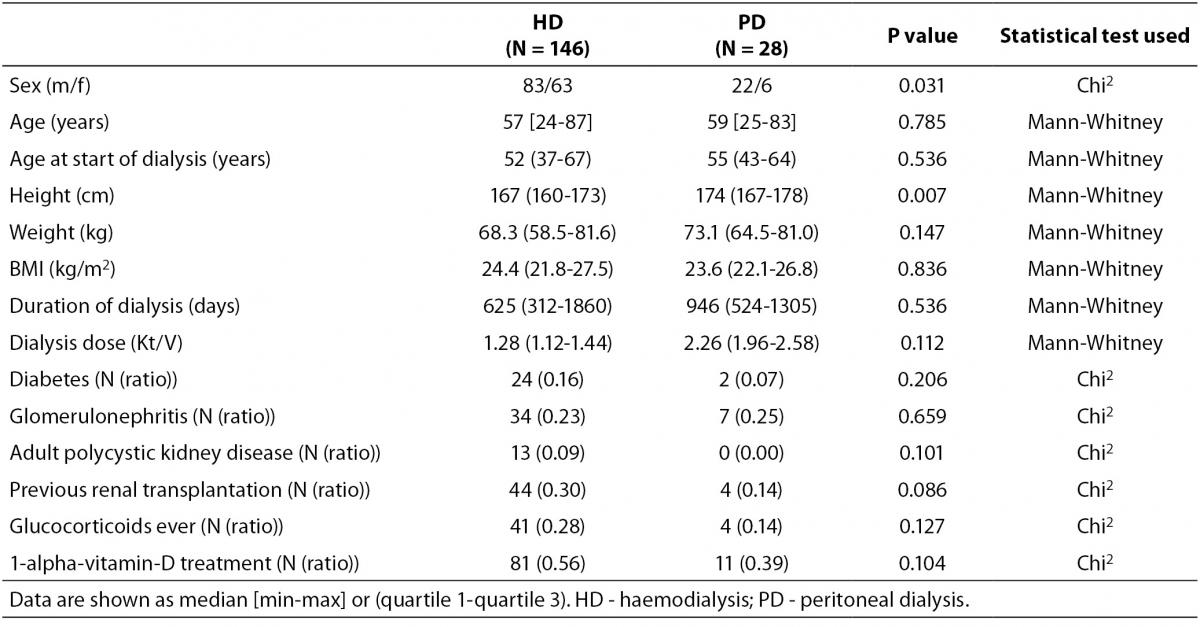
Table 2. Bone turnover markers at baseline.
As shown in Figure 1 no difference in Z-score of BMDneck, BMDspine or BMDforearm was found between patients on HD and PD: For neck HD vs. PD (median (interquartile ranges): -0.607 ((-1.425)-0.483) vs. -0.453 ((-1.487)-0.441), P = 0.801; lumbar spine HD vs. PD: 0.162 ((-0.892)-1.031) vs. -0.060 ((-0.532)-1.312), P = 0.831; and forearm HD vs. PD: -1.653 ((-2.566-(-0.591)) vs. -1.640 ((-2.634)-(-0.268)), P = 0.836. Z-score of BMDneck (-0.589 ((-1.541)-0.363), P < 0.001) and BMDforearm (-1.653 ((-2.441)-(-0.411)), P < 0.001) was significantly lower in patients on dialysis compared to zero, while Z-score of BMDspine was not significantly different from the expected (P = 0.259). Table 3 shows that Z-scores for BMD in femoral neck and forearm were significantly lower in patients who had been treated with glucocorticoids or previously received a renal transplant, while patients with adult polycystic kidney disease tended to have higher BMD in spine and forearm than the patients without polycystic disease.
Table 3. Comparison of BMD Z-scores between dialysis patients with and without potential risk factors for bone loss.
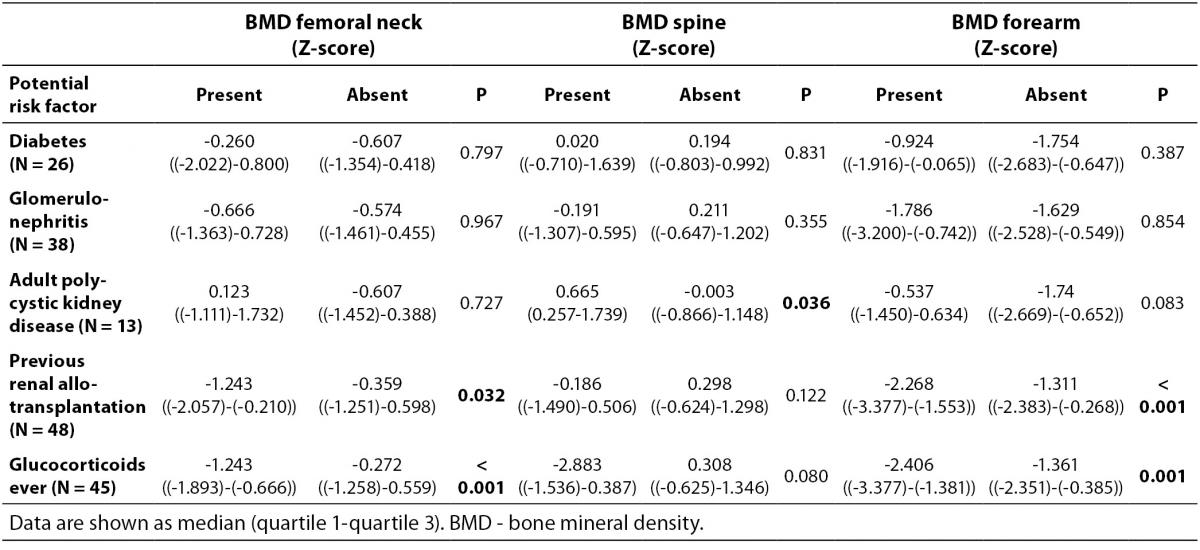
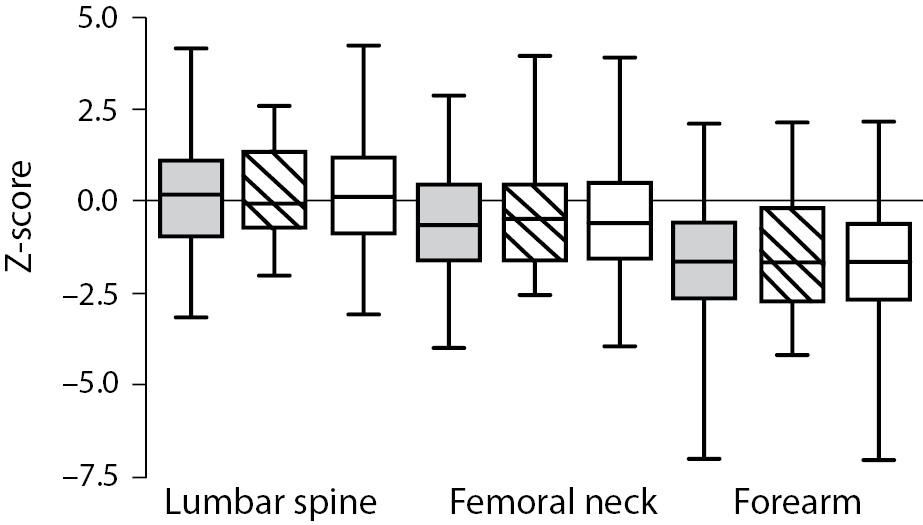
Figure 1. Bone mineral density (Z-score) in the lumbar spine, femoral neck and forearm in patients on haemodialysis (HD) or peritoneal dialysis (PD). Data are shown as median, interquartiles and range. Grey bars are HD patients, striped bars are PD patients, while white bars are all dialysis patients.
In a bivariate correlation analysis, Z-score of BMDneck was positively associated with body weight (r = 0.57, P < 0.001), actual age as well as age when starting dialysis (r = 0.38, P < 0.001 and r = 0.39, P < 0.001, respectively). Similarly, Z-score of BMDspine was positively associated with body weight (r = 0.41, P < 0.001), both actual age and age when starting dialysis (r = 0.39, P < 0.001 for both), while t-ALP showed a significant inverse association (r = -0.25, P = 0.001). Also, Z-score of BMDforearm was associated with body weight (r = 0.28, P < 0.001), while it was inverse associated with ln(duration of dialysis) (r = -0.29, P < 0.001) and t-ALP (r = -0.25, P = 0.001). In a multiple regression analysis only age and body weight remained significantly associated with BMDneck (Table 4), while age, weight, and t-ALP were associated with BMDspine and sex, body weight, duration of dialysis and glucocorticoid treatment ever were associated with BMDforearm.
Table 4. Multiple regression analysis (backwards) of associations with BMD Z-score in dialysis patients.
Longitudinal study
No patient reported to have experienced a fracture during the follow-up period. Nevertheless, a significant decrease in BMDneck (-2.1 ± 6.2%/year, P = 0.008), BMDspine (-1.1 ± 4.7%/year, P = 0.041) and BMDforearm (-0.6 ± 1.6 %/year, P = 0.004) was detected at follow-up (Figure 2). This bone loss was significantly higher than expected from the scanning of the control cohort in the femoral neck (delta Z-score = 0.20 ± 0.47/year, P = 0.002) and the forearm (delta Z-score = 0.09 ± 0.32/year, P = 0.002), and to a lower degree but still significant in the spine (delta Z-score = 0.11 ± 0.45/year, P = 0.044). In a bivariate correlation analysis, only age (r = 0.33, P = 0.012), age at start of dialysis (r = 0.31, P = 0.021), ln(serum PTH) (r = -0.33, P = 0.013), and t-ALP (r = -0.34, P = 0.009) at baseline was associated with bone loss in the spine.
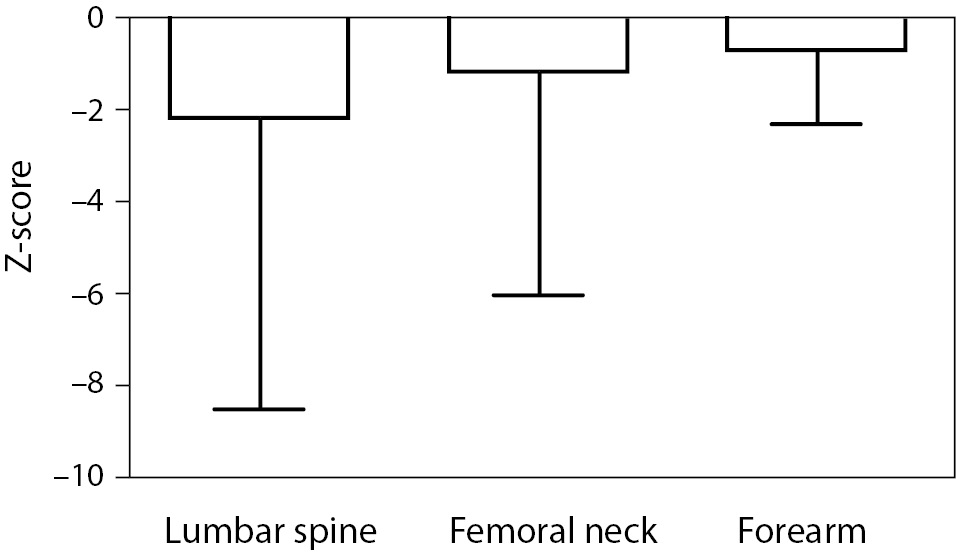
Figure 2. Change in bone mineral density Z-score over time in 73 dialysis patients after a mean period of 14 months. Data are shown as mean and SD.
Discussion
Our study has several interesting findings: We could confirm the recommended use of t-ALP as an independent marker of low BMD not only in HD patients, but also in PD patients. However, t-ALP only remained associated with decreasing BMD in the spine after adjusting for other factors. Furthermore, we found that dialysis patients had reduced BMD in their femoral neck and forearm, but not in the lumbar spine. Of note, low BMD was comparable in the two dialysis groups. Previous or current treatment with glucocorticoids was associated with low BMD, while patients with adult polycystic kidney disease interestingly tended to have higher BMD than the other patients. In the follow-up study all patients had decreased BMD in all three locations, but only for the lumbar spine there was a significant association between BMD and the bone markers t-ALP and PTH.
Assessment of bone turnover markers is recommended for CKD patients and dialysis patients (17), but reports on the recommended biomarkers are conflicting and also differs for different patient groups: our longitudinal observations demonstrated that high levels of t-ALP and PTH indeed are associated with decrease in BMD, while Atsumi et al. (9) found that HD patients with the lowest PTH had an increased risk of vertebral fractures. This can be related to differences in dialysis age in the two populations, as high PTH values can be regarded as a healthy response in young persons with low dialysis age, while a persisting high PTH would be considered as a lack of response and therefore a bad omen. Noteworthy, Atsumi et al. also found that high t-ALP concentrations predicted fractures, and altogether t-ALP seems to be an easy accessible and cheap marker of bone loss in most populations (20), except for those with concomitant liver disease (19). Our results may however question the current recommendation of a PTH higher than the limit for healthy subjects in patients with CKD (18).
Both groups of dialysis patients had increased rate of BMD loss in the femoral neck and forearm and tended to have increased bone loss in the spine compared to the expected. Only few other investigations have reported prospective data on bone loss (13,24-26), but none of the studies found changes in spine BMD, while BMD loss in the forearm (24) and the femoral neck (26) previously has been reported. Also, the finding of reduced BMD in the femoral neck corresponds well with previously published data (11-13). In subjects with normal renal function prospective studies have demonstrated that a 1 SD decrease in femoral neck BMD below the age-adjusted mean (i.e. Z-score) increases the risk of femoral neck fractures by a factor 2.8 (6). This risk-gradient could be different in renal disease, but no prospective studies have been performed. Other factors may, however, affect the risk of fracture in these patients since the incidence of femoral neck fractures seems to be four-fold increased (3). One possible factor could be muscular strength, which has been found positively related to BMDneck (27), and decreased muscle strength as well as low BMD may be related to low levels of 25-hydroxy vitamin-D (28). As mentioned, we did find a tendency towards higher BMD in patients with adult polycystic kidney disease. This could be explained by their well-known preserved renal capacity to produce 1,25-(OH)2-D better than patients with other native renal diseases.
Patients who had received glucocorticoids had lower BMD Z-score in both femoral neck and spine compared with patients who had received no such treatment. Although not significant in the multiple regression analysis it is in accordance with the profound negative effect systemic glucocorticoid treatment has on bone mass (29). These patients should thus be considered candidates for a closer continuous monitoring, e.g. by the use of t-ALP and PTH measurements.
Young age and young age when initiating dialysis was associated with low BMD Z-score in our study. This is in agreement with other studies indicating that children and young adults may be vulnerable regarding bone loss both before and after starting dialysis (13). The apparent bone deficit in children with renal failure is to some extend due to growth retardation, but only very few of our patients started on dialysis before reaching peak bone mass. Since Z-scores were used in the calculation, the age-related decline in BMD was corrected for. Thus, the positive correlation between age and BMD Z-score indicates that bone deficit was higher in the young compared with the older patients although BMD in absolute terms was lower in the older patients.
Our study has several limitations. First, patients on dialysis suffer a number of different kidney diseases that may differ regarding their impact on bone metabolism as discussed above. But since DXA was part of clinical routine in all patients on dialysis, our study reflects bone status of unselected patients. Second, the follow-up period was relatively short and not all patients had a follow-up scan, which could introduce a bias. Routine DXA was stopped since interpreting the results in individual dialysis patient is now considered difficult (18). Also, there was a rather large percentage of drop-out in the follow-up study due to the well-known increased mortality in this patient group, but still we feel certain that it gives a good picture of this heterogeneous group and also naturally reflects the high mortality. Thirdly, there was a rather widespread time range for the follow-up, which was originally scheduled to take place after one year, but since bone loss was calculated per 12 months we find it doubtful that timing of the scanning skewed the observations. Finally, our study does not give an accurate estimate of the cost-effectiveness in using such biomarkers; in order to do this a larger prospective study would be needed. Nevertheless, we do feel certain that use of biomarkers will improve clinical practice for these multi-morbid patients.
Worth noting, our study also possesses several strengths: data were available for all patients, and the size of our study allowed analysis of the impact of several potential risk factors for low BMD and change in BMD. Also, measurement of BMD using DXA is unaffected by dialysis (30).
In conclusion, BMD of the femoral neck and forearm was significantly decreased in dialysis patients with no difference between patients on HD and PD, while BMD in the lumbar spine was within normal limits. Determinants of low BMD were young age, low body weight, and high levels of t-ALP, while decline in BMD in the lumbar spine at follow-up only was associated with young age at initiation of dialysis and high levels of PTH and t-ALP. Our study thus confirms that the use of PTH and t-ALP as markers of bone turnover provides a good assessment of bone loss over short periods of time in both types of dialysis patients and is faster and easier accessible than a DXA scan.
Acknowledgements
The authors thank Ann Østergaard, Dorte Westergaard and Elsebeth Byrge for secretarial assistance. Also, Rikke Kiilsholm, Bente Tøt, Anette Riis Madsen, Kirsten Westerman, and Donna Arbucke are acknowledged for excellent technical assistance.