Introduction
Insulin resistance (IR) is defined as less than normal response to insulin, which leads to hyperinsulinemia for euglycemic conditions to be maintained (1). Compensatory hyperinsulinemia due to enhanced β-cell secretion is therefore an obligate accompanying feature in IR. The main characteristics of IR are disinhibited gluconeogenesis, impaired uptake of glucose by muscle and disinhibited lipolysis in adipose tissue.
Clinical markers of IR are visceral obesity, acanthosis nigricans (2), acne, hirsutism (3) and hepatic steatosis (1).
The golden standard for evaluation of IR is hyperinsulinemic euglycemic clamp: insulin is infused at a constant rate and glucose is held at basal levels by glucose infusion. The rate of the latter is a measure of all tissues’ glucose uptake (4). Alternative measures of IR are fasting plasma insulin concentrations (2) and homeostasis model assessment (HOMA) derived from fasting plasma insulin and glucose concentrations (5).
The etiology of IR includes genetic factors resulting in syndromic forms of IR, and environmental factors: food intake, poor physical activity, aging, smoking or administration of drugs – thiazide diuretics, beta adrenergic antagonists and glucocorticoids, which can cause or contribute to IR (2). The most important factor is obesity, which is usually of combined polygenetic and environmental origin (2, 6). Abdominal adipose tissue is a source of free fatty acids (FFA) and various hormones (adipokines) implicated in the development of IR. Conversely, restricted calorie intake, weight reduction and physical activity improve insulin sensitivity (2, 3, 7).
The present paper explains the mechanisms of IR which include disregulated secretion of adipokines and increased efflux of FFA from central adipose tissue, and other insulin prereceptor, receptor and postreceptor impairments.
The Mechanisms of Insulin Resistance
Tumor necrosis factor α and free fatty acids
Numerous studies have found associations between increased tumor necrosis factor a (TNF-a), interleukin 6 (IL-6), macrophages and monocyte chemoattractant protein-1 (MCP-1), plasminogen activator inhibitor-1 (PAI-1), adipsin, and decreased adiponectin with IR (8).
In the majority of obese patients IR is an accompanying feature. Adipose tissue releases great amounts of TNF-a, which is at least partly responsible for the development of IR in obesity (9). On the other hand, weight loss is well known to increase insulin sensitivity, which is thought to be mediated in part by decreased adipose TNF-a release (10). TNF-a is the main autocrine/paracrine factor triggering the secretion of FFA from adipose tissue into the circulation (9). However, it remains unclear which factors actually trigger the release of adipokines from adipose tissue.
TNF-a mediates repression of many genes responsible for glucose and FFA uptake and storage. For 3T3-L1 adipocytes it has been shown that TNF-a dependent gene up- and down-regulation occurs by obligatory activation of nuclear transcription factor kB (11). Upon TNF-a action, enhanced lipolysis occurs with the release of FFA and cytokines.
TNF-a and FFA impair insulin signaling in insulin responsive tissues, especially muscle. The released FFA, according to the lipid supply hypothesis (Randle hypothesis), act as a predominant substrate in intermediary metabolism. Increased NADH/NAD+ and acetyl-CoA/CoA ratios could be the reason for the decreased glucose uptake, which means impaired insulin sensitivity (12, 13). Visceral adipose tissue secretes FFA directly to the portal blood flow thereby exerting potent effects on the liver rather than subcutaneous adipose tissue releasing its products to peripheral circulation (1).
In the liver, high amounts of FFA provide an abundant substrate for triglyceride and VLDL-synthesis, and gluconeogenesis. TNF-a represses genes for glucose uptake and beta oxidation (14). De novo cholesterol synthesis occurs followed by TNF-a up-regulation of the corresponding genes (8).
FFA also trigger fibrinogen and PAI-1 synthesis in the liver (15). FFA draining from visceral adipose tissue to portal circulation and to the liver decrease hepatic insulin clearance, thereby contributing to hyperinsulinemia (13). Excess triglycerides are accumulating in the liver (1).
In the muscle, high FFA concentrations favor beta oxidation, which diminishes glucose uptake and oxydation (16). However, beta oxidation is inadequate to clear FFA efficiently from the circulation, even more in the lack of physical activity (17). Glycogen synthesis in the muscle is inhibited. Muscle is in force as the main glucose disposer (80%–90%) and diminished uptake contributes largely to hyperglycemia (9, 18). Excess FFA are stored as triglyceride droplets in the muscle (1, 7, 17).
In adipose tissue, FFA inhibit lipoprotein lipase activity which is otherwise stimulated by insulin, and thereby render clearance of FFA from circulation impossible (19). Overall, lipids released from adipocytes as FFA are transported as triglycerides by VLDL and shifted to non-adipose tissues (20).
TNF-a has been shown to down-regulate the genes for adiponectin, glucose transporter 4 (GLUT4), insulin receptor substrate-1 (IRS-1), CCAAT/enhancer binding protein a (C/EBP-a), peroxisome proliferator-activated receptor g (PPAR-g) and perilipin in adipocytes (11, 14). TNF-a up-regulates many genes expressed in adipose tissue, which are responsible for inflammation, immune response and energy balance (vascular cell adhesion molecule-1 (VCAM-1), plasminogen activator inhibitor-1 (PAI-1), IL-6, IL-1β, angiotensinogen, resistin, leptin) (14).
Leptin
Leptin is a hormone secreted predominantly by adipose tissue and is a signal of energy sufficiency. It decreases food intake and increases energy expenditure (21). These effects are mediated by leptin action on the hypothalamus and directly on target tissues (muscle, gonads, b-cells, liver) (22). In normal conditions of weight maintenance leptin concentrations positively correlate with total body fat mass. In short term food deprivation serum leptin levels decrease and the opposite is true for short term overfeeding (23).
Leptin represents an essential fertility factor as decreased leptin concentrations following food deprivation have been shown to be responsible for the suppression of the hypothalamic-pituitary-gonadal axis (24).
Clinical states with diminished adipose mass (lipodystrophies) are characterized by reduced plasma leptin concentrations and IR. Leptin administration significantly improves insulin sensitivity in these conditions (25), indicating that normal amount of adipose tissue is critical for normal insulin sensitivity, and this is at least partly fulfilled via leptin secretion and its effects.
An important leptin effect is sympathetic stimulation achieved by eliciting leptin-responsive neurons in the hypothalamus (8). This could in part explain the development of hypertension in visceral obesity and non-obese states. In accordance with this, muscle sympathetic activity in non-obese normotensive men correlates well with protein-bound leptin concentrations (26).
Adiponectin
Adiponectin shows strong inverse correlation to IR in lipodystrophy and obesity, and to inflammatory states (27, 28). It is secreted exclusively by adipocytes (27). Adiponectin improves insulin sensitivity by various mechanisms: in the liver, it induces fatty acid oxidation, decreases lipid synthesis, decreases uptake of FFA and represses gluconeogenesis by enzyme down-regulation (8, 23, 29). In muscle, adiponectin favors glucose and FFA oxidation. These effects are partly due to the activation of AMP-kinase (27). Thereby, adiponectin decreases plasma FFA and glucose levels (8, 23). FFA catabolism is stimulated either directly or through stimulation of PPAR-g nuclear receptors (30).
Adiponectin decreases the expression of adhesion molecules on blood vessel wall, inhibits chemotaxis of macrophages and their conversion to foam cells, proliferation of smooth muscle cells and inflammatory events in atherogenesis, which are promoted by IL-6, PAI-1 etc. (8). Adiponectin also suppresses secretion of TNF-a (31).
Adiponectin levels increase with weight loss (32) and treatment with thiazolidinediones (TZD) (33), which are PPAR-g agonists. The synthesis of adiponectin is impaired in the states of calorie excess, which might be associated with leptin resistance or deficiency (23). Insulin and insulin-like growth factor (IGF-1) stimulate adiponectin synthesis (23).
Similarly, IL-10 also exerts an antidiabetogenic effect: in obesity without the metabolic syndrome IL-10 plasma levels are increased, but in the metabolic syndrome IL-10 is decreased (34).
Resistin
Resistin is secreted to a much greater extent by visceral than by subcutaneous adipose tissue (8). In rodent obesity, serum resistin levels are increased and some experiments have confirmed resistin as causing IR (35). However, some other studies failed to confirm these results (8, 36).
Human resistin shows only 64% homology with rodent resistin (37) and expression of resistin in human adipocytes is not uniformly associated with IR or obesity (23). On the other hand, TZD may exert their effects partly through a diminished action of resistin as its secretion is decreased during TZD therapy (23). Taken together, the role of resistin in humans remains to be further elucidated.
Other adipokines
Macrophages and monocyte chemoattractant protein-1 (MCP-1) are directly causally associated with IR: MCP-1 impairs glucose entrance and insulin signaling in cells (38). MCP-1 is secreted by adipocytes; it attracts macrophages to adipose tissue and promotes their IL-1 and TNF-a release (8). It also inhibits adipocyte growth and differentiation. MCP-1 promotes atherosclerosis by attracting macrophages and favoring their accumulation in vessel walls (39).
PAI-1 has higher expression in visceral compared to subcutaneous adipose tissue (40). It is strongly associated with visceral obesity, IR and metabolic syndrome. PAI-1 is hypothesized to contribute to obesity and IR, and has a causal role in further development of cardiovascular disease for its prothrombotic activity (8). PAI-1 plasma levels decrease after weight loss (8) and therapy with insulin sensitizing substances (41).
Studies with IL-6 have suggested its causal role in IR, as plasma concentrations and adipose tissue expression, and polymorphisms of IL-6 correlate well with obesity and IR. IL-6 was shown to interfere with insulin signaling (42), and to inhibit adipogenesis and secretion of adiponectin (8). IL-6 also induces IR in the liver and adipocytes (43).
In the central nervous system IL-6 has opposite effects – suggesting that it favors energy expenditure. Administration of IL-6 to IL-6 gene knockout rodents reversed obesity (44).
Glucocorticoids
Glucocorticoids are well known insulin antagonists. They oppose the effects of insulin and thereby could induce IR. They act on both levels of IR: they enhance liver gluconeogenesis and glucose release, and impair glucose uptake by peripheral tissues. The mechanism for the latter are previously mentioned high levels of FFA, and there are at least three possible ways how lipolysis can occur:
1. glucocorticoids increase norepinephrine conversion to epinephrine (phenyl-ethanolamine N-methyltransferase in skeletal muscle), which acts on hormone sensitive lipase in adipose tissue and performs lipolysis (45);
2. they mediate lipolysis via up-regulation of PPAR-g (46); and
3. they inhibit lipoprotein lipase and thus disable the uptake of FFA by adipose tissue (47).
In skeletal muscle impaired translocation of GLUT4 was shown as a consequence of glucocorticoid action (48). Glucocorticoids were shown to inhibit vasodilatation (induced by insulin via nitrogen oxide) and less glucose was then delivered to target tissues (49). These effects of glucocorticoids are even potentiated by FFA increasing glucocorticoids binding to their receptors (50).
Molecular Mechanisms of Impaired Insulin Signaling
Normal insulin signaling
Insulin receptor is a heterotetramer receptor, which is expressed on the liver, adipose and skeletal muscle cells. Binding of insulin triggers oligomerization and receptor autophosphorylation on tyrosine residues and tyrosine phosphorylation of IRS-1, -2, -3, -4, IRS5/DOK4, IRS6/DOK5. This phosphorylation provides the base for following association with downstream signal proteins which diverge into three different pathways: phosphoinositide-3-kinase (PI3K) pathway, CAP/Cbl/TC10 pathway and mitogen-activated protein kinase (MAP-kinase) dependent pathway (Fig. 1) (51, 52). PI3K interacts with phosphorylated Tyr on IRS molecules and upon formation of phosphatidylinositol-3,4,5-triphosphate (PIP3) various protein kinases are activated (53). As a consequence, glycogen synthase kinase 3 (GSK-3) is inactivated, which at the final stage results in glycogen synthesis; the fatty acid synthase gene is up-regulated and phosphoenolpyruvate carboxykinase (PEPCK) gene is down-regulated. An essential effect of PI3K pathway is translocation of the main glucose transporter GLUT4 to the plasma membrane (51, 52). Protein synthesis is activatedvia enzyme mammalian target of rapamycin (mTOR) activation (54). For glucose uptake to manifest fully, the adapter protein CAP recruits proto-oncogene Cbl to the phosphorylated insulin receptor, which finally results in reinforced GLUT4 translocation (51). The third pathway leads to MAP-kinase activation and cellular proliferation and differentiation via gene transcription regulation (52, 55).
Defects in insulin signaling
A minority of insulin resistant cases are characterized by a single genetic or acquired trait. Anti-insulin autoantibodies have been found in diabetes mellitus DM type 1 (DM1) (56). On the other hand, more than 60 mutations have been identified in the insulin receptor gene. Among them type A IR is associated with heterozygous mutation state which underlies decreased Tyr phosphorylation of the β-subunit after insulin binding (57). In Rabson-Mendenhall syndrome and leprechaunism (Donohue syndrome) insulin receptor gene mutations are presumed to impair insulin binding to the receptor (57). IR may be due to abnormal production of anti-insulin-receptor antibodies (type B IR) (58). PPAR-g mutations which are not associated with lipodystrophy are also reported to cause IR (59).
_Mlinar_B._i_sur._Slika_1.jpg)
Figure 1. Insulin signal transduction (51-55). After insulin receptor Tyr autophosphorylation, insulin receptor substrates 1 to 4 (IRS-1 to 4) Tyr phorphorylation takes place and subsequently three different pathways transduce the signal: PI3K-dependent pathway mediating metabolic responses including glucose/lipid/protein metabolism and insulin-stimulated glucose uptake; CAP/Cbl pathway which is additionally required for glucose transporter-4 (GLUT4) translocation; and mitogen-activated protein kinase (MAPK) pathway resulting in cell proliferation and differentiation. Solid line: stimulation; dashed line: inhibition. IRS, insulin receptor substrate; PI3K, phosphoinositide-3-kinase; PDK-1, phosphoinositide-dependent kinase 1; PKB, protein kinase B; aPKC, atypical proteinkinases C; mTOR, mammalian target of rapamycin; p70S6K, p70 ribosomal S6 kinase; PEPCK, phosphoenolpyruvate carboxykinase; GSK3, glycogen synthase kinase 3.
Some studies report an increased degradation of insulin receptor (60). Besides, it is hypothesized that serine/threonine phosphorylation by various protein kinases C (PKCs) could be an additional factor to regulate insulin receptor activity (61). Decreased Tyr phosphorylation state of IRS-1 that was found in hyperinsulinemic ob/ob mice could be a consequence of decreased insulin receptor activity (62).
Recent studies focus mainly on increased Ser/Thr phosphorylation of IRS-1, which could be a consequence of increased TNF-a concentrations and further exacerbated by hyperinsulinemia which is secondary to IR. PKCs, PI3K-downstream kinases and MAP-kinases are thought to be responsible for Ser/Thr phosphorylation, which is followed by enhanced proteasomal degradation of IRS-1. Namely, decreased IRS-1 protein content has been reported in humans, animals and cultured cells with IR (51).
It is to emphasize that certain basal Ser/Thr phosphorylation state of IRS-1 is necessary for successful Tyr phosphorylation and insulin signaling. Therefore, it remains to be elucidated to which degree and on which Ser/Thr sites IRS-1 must be phosphorylated to display its diverse effects.
Besides mediating IRS-1 degradation, hyperinsulinemia might affect protein concentration of IRS-2 and provoke some downstream changes in insulin signaling (51).
TNF-a, IL-6 and insulin induce another important group of IR factors – suppressors of cytokine signaling (SOCS-1 and -3), which have at least three different mechanisms of action: they compete with IRS-1 for association with insulin receptor, they inhibit Janus kinase, involved in insulin signaling, and they augment proteasomal IRS-1 degradation (63).
Hyperglycemia was shown to severely decrease protein kinase B (PKB) activity, although some other proximal components of insulin signaling (insulin receptor, IRS-1, IRS-2, PI3K) were activated.
FFA in high plasma concentrations were shown, by transformation to diacylglycerol and acyl-CoA, to diminish the activities of IRS-1, -2 and activities of PI3K and various isoforms of PKB and PKC in rat muscle (51). In transgenic mice, FFA increased the activity of Munc18c protein, a negative regulator of GLUT-4 translocation to plasma membrane (64). Nevertheless, unsaturated FFA have benefit to allow normal insulin sensitivity in some target tissues (51).
Glycated proteins, emerging as a consequence of hyperglycemia were shown intracellularly to diminish the PI3K, PKB, and GSK-3 activity, thus possibly contributing to IR. Similarly, glucosamine (UDP-N-acetyl glucosamine), produced from glucose and being the main substrate for cellular glycosylation, enhances IRS-1 glycosylation thereby decreasing its activity, and glycogen-synthase glycosylation, which reduces its insulin responsiveness (51).
Obesity
The state of nutrition is best described by body mass index (BMI). BMI is calculated by dividing a person's weight in kilograms by the square of his height in meters. BMI is, with some exceptions, in good correlation with the amount of total body fat. According to BMI, the following categories of excessive body mass or nutrition are postulated (65):
BMI 25-30 kg/m2 overweight
BMI 30-40 kg/m2 obesity
BMI 40-50 kg/m2 morbid obesity
BMI >50 kg/m2 extreme obesity
Insulin and leptin resistance in obesity
Visceral obesity predisposes to the development of hypertension, diabetes mellitus type 2 (DM2), cardiovascular disease, and certain types of cancer (66). An increased risk for health exists already in the overweight group. Besides total body fat mass, distribution of fat is essential for eventual metabolic complications. Visceral and subcutaneous adipose tissues differ in their endocrine activities. Specific receptors such as angiotensin II receptors type-1 (AT1), β1-, β2-, β3-adrenergic receptors, glucocorticoid and androgen receptors are represented to a larger degree in visceral adipose tissue where they promote lipolysis (8, 67, 68). On the other hand, antilipolytic insulin receptors, a-2A adrenergic receptors, and estrogen receptors are predominantly expressed in subcutaneous adipose tissue (67, 68). Additionally, visceral adipose secretes its products to the portal circulation, which brings the released FFA directly to the liver where they promote gluconeogenesis, VLDL synthesis, decrease glucose uptake and cause overall IR.
Visceral adipose tissue is characterized by a relatively higher secretion of IL-1 and PAI-1, whereas leptin and adiponectin secretion is greater in subcutaneous adipose tissue (8). This accounts for the relationship between visceral obesity and inflammatory/thrombotic events, and explains the effectivity of TZD to improve insulin sensitivity by redistribution of lipids to subcutaneous adipose tissue (69).
In obese individuals there are increased plasma leptin concentrations and exogenous administration of leptin has no effect on body weight (8). The phenomenon has been explained as leptin resistance or desensitization (23). Besides, soluble leptin receptor concentrations are low in obesity and hence the fraction of bound leptin concentrations. This feature is independently associated with abdominal obesity and IR. Soluble leptin receptors are thought to be important for transport to or over the blood – brain barrier and it is the saturation of this transport or impairment of leptin receptor signal transduction that may be the cause of leptin resistance. Leptin concentrations in the cerebrospinal fluid of obese patients are only modestly increased (23).
The pathophysiology of obesity
Each individual has a genetically determined weight set-point and hence body weight is tightly regulated by an energy homeostatic mechanism (Figure 2) (6, 66, 71). Adipocytes secrete leptin and β-cells secrete insulin, both in proportion to the body-fat content. The two hormones enter the brain. They bind to their central receptors on the hypothalamic neurons exerting effects to reduce body weight. Hypothalamic neurons express peptides and their receptors that could be categorized as orexigenic: neuropeptide Y, agouti-related protein (AgRP), melanin-concentrating hormone (MCH), orexins A and B; or anorexigenic: melanocortins (i.e. melanocyte-stimulating hormone, a-MSH) and cocaine and amphetamine related transcript (CART). In leptin or insulin abundance the anorexigenic pathways prevail: increase of energy expenditure, increase of thermogenesis, diminished food intake. Decreased leptin and insulin serum concentrations lead to the activation of orexigenic pathways resulting in low metabolic rate and enhanced appetite (6).
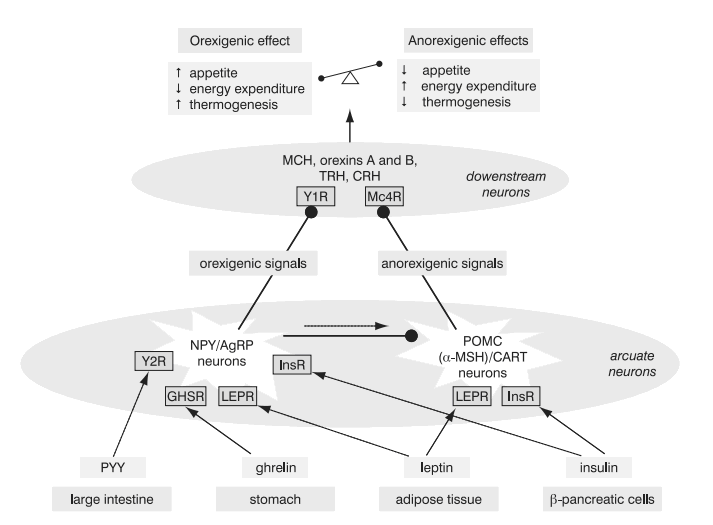
Figure 2. Energy homeostasis. NeuropeptideY (NPY)/agouti related protein (AgRP) neurons and proopiomelanocortin (POMC)/cocaine and amphetamine related transcript (CART) neurons in the arcuate nucleus in the hypothalamus receive signals from the periphery. They relay orexigenic and anorexigenic signals to the downstream neurons, which provide balance between the food intake and energy expenditure (6,66,71).
Solid line: stimulation; dashed line: inhibition. PYY, peptide YY3-36; Y1R and Y2R, subtypes of neuropeptide Y receptor; a-MSH, a-melanocyte stimulating hormone derived by cleavage of POMC; Mc4R, melanocortin 4 receptor; GHSR, growth hormone secretagogue receptor (receptor for ghrelin); InsR, insulin receptor; MCH, melanin concentrating hormone; TRH, thyrotropin-releasing hormone; CRH, corticotropin-releasing hormone.
Leptin and insulin mediate long-term body mass regulation. They are also active in short-term signalsthat effect single meal to be initiated and terminated. In addition, there are some other short-acting hormones/factors which accompany food intake: ghrelin, motilin, neuromedin U, neurotensin (70), cholecystokinin, peptide YY3-36 (PYY) (72) and glucagon-like peptide-1 (72), all secreted by the gastrointestinal tract, and vagal afferent signaling (71). Ghrelin is secreted by the stomach fundus and increases the sense of hunger and stimulates gastric emptying (70), whereas PYY signals satiety and inhibits gut motility (71). Ghrelin stimulates neuropeptide Y and AgRP neurons, while PYY exerts inhibition of the same neurons in animals (71). Recently, a peptide derived from the same prohormone as ghrelin, was discovered. It has been named obestatin and it opposes the effects of ghrelin (73).
Particularly the leptin-melanocortin anorexigenic signaling pathway appears to be very conserved among species, and mutations in genes encoding for components of this pathway: leptin, leptin receptor, pro-opiomelanocortin (POMC), prohormone-convertase 1 (PC1), and melanocortin 4 receptor (Mc4R), cause rare forms of morbid monogenic obesity and lead to some naturally occurring murine models of obesity (ob, db, Ay and mg) (6). On the contrary, knockouts in genes for orexigenic pathways in mice fail to produce lean phenotypes, demonstrating the extremely powerful mutual effects of anabolism and weight gain system components (71).
Today’s high incidence of obesity could be explained by the “thrifty genotype” hypothesis: over periods of time the alleles were selected which favored weight gain and fat storage in order to provide enough nutrients for times of food deprivation. In today’s times of food availability and decreased physical activity such genotypes cause obesity (74).
The potential of the body to precisely maintain body weight is reflected in the failure of interventions aimed at body weight reduction. Calorie-restricted diet results in compensatory increase in ghrelin levels thereby stimulating eating (71). Reduction of body weight results in the fall of leptin levels, which again stimulates weight gain (71). Surgical removal of adipose tissue results in restoration of fat at new locations, and stimulation of thermogenesis by adrenergic β3-agonists elicits a compensatory central nerve system response (6). Only extreme intervention in mice with gross overexpression of uncoupling protein-3 (UCP-3), which is a signal protein in thermogenesis, was successful to override central adaptive mechanisms, and mice remained lean (75). In humans, gastric bypass surgery is successful as it results in ghrelin plasma concentration decrease and PYY increase, which suppresses hunger and maintains reduced body weight (71).
Development of lean animal model by suppression of adipose tissue development resulted in hyperphagic mice with severe insulin resistant diabetes (76). The hypothesized mechanism causing IR was leptin and adiponectin deficiency due to the absence of adipose tissue. Namely, the administration of these hormones together reversed IR (77). Thus, these two hormones appear to be required for normal insulin sensitivity.
Besides monogenic forms of obesity there are at least 20 rare syndromes with obvious genetic basis, which appears to be more complex as it predisposes more dysfunctions (mental retardation, multiple signs of hypothalamic disorder) (66).
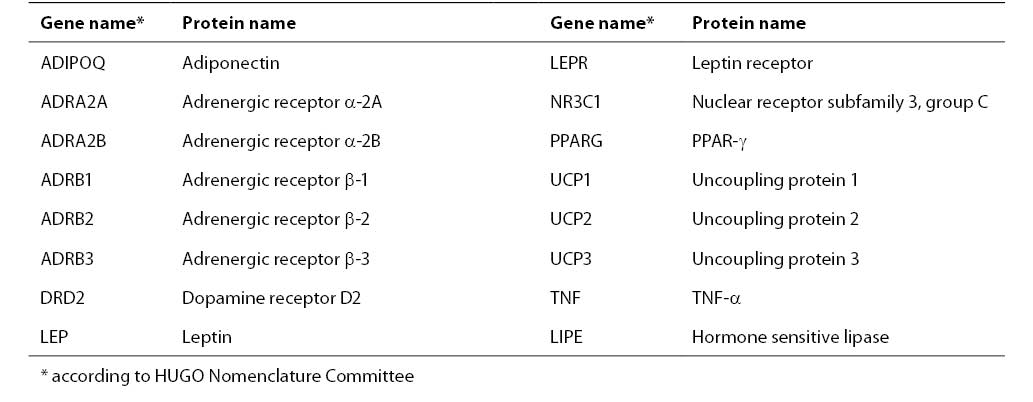
The common human obesity is thought to be an oligogenic state and its expression is modulated by multiple modifier genes and by environmental factors: food intake, physical activity, and smoking (6). The genetic basis in the pathophysiology of obesity is estimated to be 40%-80% (66). At least 204 putative gene loci associated with obesity have been identified, and those which have been confirmed by multiple studies are presented in Table 1 (78).
Table 1. The list of genes associated with obesity confirmed by 5 or more studies
Metabolic Syndrome
The first recognition of clustering of hypertension, hyperglycemia and gout came already in the twenties of 20th century (1). In 1988, Reaven identified syndrome X originating from IR. In 2004, the National Cholesterol Education Program’s Adult Treatment Panel III (ATPIII) defined the metabolic syndrome with alternative names: IR syndrome, Reaven syndrome, characterized by the following components (G52):
- abdominal obesity
- atherogenic dyslipidemia
- hypertension
- IR
- proinflammatory state
- prothrombotic state
These clinical features are strong risk factors for DM2 and cardiovascular disease with additional possible complications including cholesterol gallstones, sleep apnea, polycystic ovary syndrome in women, fatty liver and some types of cancer (7).
Three possible etiologies for the metabolic syndrome have been postulated: obesity was found to be responsible for excess release of FFA, cytokines and other proinflammatory products which are implicated in the development of IR, hypertension and dyslipidemia.
IR as the second possible cause of metabolic syndrome rises a question of whether it is possible to dissociate between obesity and IR. Indeed, IR exists to various degrees in all particular classes of body mass index, suggesting an independent inheritable contribution of it to at least some extent. Some populations (South Asians) with mild overweight display IR and this is said to be primary IR. From this point of view IR can be classified as a separate etiological factor for metabolic syndrome. Hyperinsulinemia as a consequence of IR is capable to increase VLDL secretion from the liver and to cause hypertension. IR of muscle can cause hyperglycemia, exaggerated by gluconeogenesis in insulin-resistant liver (7).
The third etiology is thought to include independent factors: immune, vascular, hepatic, etc., which are influenced by specific genetic background of an individual, and by environmental factors (7).
Clinical manifestations and criteria for the diagnosis of metabolic syndrome
Glucose and FFA plasma level
As a consequence of IR, hyperinsulinemia develops. In this condition plasma FFA concentrations are only moderately elevated, but glucose concentration can be normal or increased, the latter denoting impaired glucose tolerance which is demonstrated by oral glucose tolerance test (OGTT) values above normal, yet not elevated enough to define DM (79). Another possible feature in the metabolic syndrome is impaired fasting glucose (7). When plasma insulin concentrations decline, as a result of β-cell degeneration, FFA levels increase considerably with accompanying hyperglycemia and the condition of metabolic syndrome grows to DM2 (79).
Atherogenic dyslipidemia
As a consequence of increased liver VLDL synthesis hypertriglyceridemia occurs. Plasma HDL is decreased with a greater proportion of small dense HDL. Similarly, the composition of LDL is shifted towards predominance of small dense LDL. The latter is thought to be more atherogenic than ordinary LDL. Changes of apolipoproteins also occur (1).
Hypertension
In healthy subjects insulin stimulates sympathetic nervous system and acts on blood vessels causing vasodilatation. Insulin also stimulates sodium reabsorption in the kidney. In insulin resistant state the vasodilatation can be lost but the renal effect and sympathetic stimulation are maintained and even increased. Both contribute to hypertension, which is further exacerbated by FFA favoring vasoconstriction. Nevertheless, it appears that the events linked directly to IR play only a moderate role in the development of hypertension (1). Additionally, leptin might have some contribution to hypertension as protein-bound leptin plasma concentrations in normotensive men correlate with sympathetic nerve activity (26).
Other clinical features
Proinflammatory state is characterized by a rise in plasma C-reactive protein, and prothrombotic state by elevation of PAI-1 and fibrinogen (7). Additional manifestations of the metabolic syndrome are fatty liver and steatohepatitis because of increased liver VLDL production in the state of IR, hyperuricemia, increased homocystein, and vascular abnormalities with microalbuminuria (1). Particularly interesting is hyperuricemia which is most likely a consequence of hyperinsulinemia: the kidney which maintains normal sensitivity to insulin, adapts to high insulin concentrations by decreased uric acid secretion, thereby elevating its plasma level (79).
Another important clinical marker of IR is acanthosis nigricans (2), which manifests as hyperpigmented skin changes based on epidermal hyperplasia. The feature is thought to be related to the hyperinsulinemic state, as insulin was shown to accelerate epidermal cell growth in culture (80).
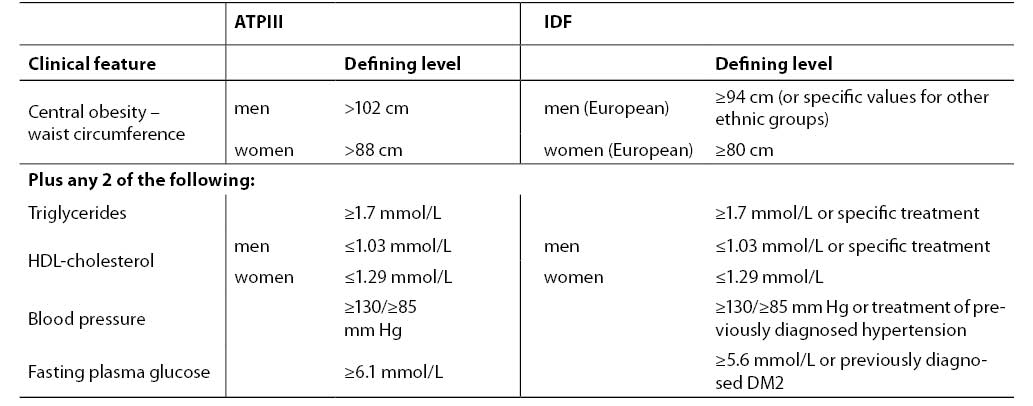
Diagnostic criteria accepted by ATPIII and International Diabetes Federation (IDF) are presented in Table 2. According to ATPIII agreement, patients having at least 3 of 5 characteristics can be diagnosed as having the metabolic syndrome: abdominal obesity, elevated triglycerides, decreased HDL-cholesterol, increased blood pressure or increased fasting plasma glucose (7). IDF declares criteria fairly consistent with ATPIII (82). Slight differences include central obesity as the major feature and fulfilled two of four other manifestations. The borderline glucose concentration is lower in IDP criteria, with a strong recommendation for OGTT when exceeded.
Table 2. Diagnostic criteria for metabolic syndrome according to ATPIII (7) and IDF (81)
Conclusion
The main underlying cause of IR is visceral obesity, as visceral adipose tissue is more prone to lipolysis than subcutaneous adipose tissue. The most important mechanisms for the development of IR are thought to be increased secretion of FFA, and decreased adiponectin, leptin, IL-6 and other adipokine concentrations. Besides the coexistence of IR with obesity and other features known as metabolic syndrome, IR is thought to play an important role in the development of polycystic ovary syndrome in women (82) and is the main feature of lipodystrophies (83). The latter are characterized by selective loss of adipose tissue, which indicates that a certain amount of adipose tissue is necessary for normal insulin sensitivity, presumably by providing the place for triglyceride storage and by secreting sufficient adiponectin and leptin (77).
However, the etiology of IR-associated disorders remains to be fully elucidated. There are some objections to defining obesity and related cardiovascular risk factors as the metabolic “syndrome” for the uncertainty about their common origin (84). On the other hand, some important knowledge is arising such as about a newly discovered insulin-mimetic adipokine derived from adipose tissue. It has been named visfatin for being detected in a much higher concentration in visceral than in subcutaneous adipose tissue. It has been shown to lower plasma glucose concentration and to act independently of insulin, presumably by binding to a different binding site of the same receptor (85).
Better understanding of the mechanisms leading to IR and associated diseases, and discovery of additional therapy targets such as visfatin would prove beneficial in the management of the most serious complications of IR, DM2 and cardiovascular disease.