Introduction
Experiments in clinical and research laboratories often require mRNA in situ localization of tissue specific biomarkers and their quantification within specific cells in the tissue (1,2). Thirty-seven years have elapsed since the first protocol for in situ was published (3). Since then, numerous papers have been published on this technique, which is now widely applied in basic and clinical research (4-7). There are publications describing that non-radioactive in situ hybridization can exhibit equivalent sensitivity as radioactive hybridization (8). Ideally, such techniques would allow for detection of very low abundant mRNAs at the cellular level but with sensitivity and quantification capabilities of radioactive labeled probes 33P or 35S. Several laboratories prefer detection with colorimetric methods rather than fluorescent; the reason is that the result is not sensitive to light, it will not fade away with time, and there is no rush with the pictures which can also be retaken without a fluorescent microscope. The advantage of fluorescent methods is co-localization of mRNA in situ since these methods permit very good detection of multiple probes and easy quantification of hybridization signal. On the other hand, fluorescence in situ hybridization has traditionally been conducted with difficulties involving low signal, high background, and auto-fluorescence, especially in bone tissue (9).
Most of the published protocols for non-radioactive in situ hybridization were developed using thick cryosections (10-12), and few protocols with paraffin embedded tissue (13,14). This approach was applied for temporal and spatial patterns in soft tissue with high abundant genes. For high resolution signal in thin sections of bone tissue and teeth using low abundant genes at a single cell level, more sensitive hybridization protocols and solutions were needed.
Fortunately, the advent of the tyramide signal amplification (TSA, PerkinElmer), a system which we applied to increase sensitivity, has resolved some of these issues (15).
In this report, we provide a detailed protocol for detection of mRNA using signal amplification and enhanced color developing techniques compared to two otherdifferent non-radioactive techniques and one radioactive in situ hybridization technique also developed and applied in our laboratory. These techniques are very sensitive and can be used on thin paraffin sections of soft as well as demineralized tooth and bone tissues. These techniques can detect signals of low abundant genes with the same sensitivity of radioactive methods but at the level of single cell, which can be quantified.
Materials and methods
Preparing the RNase-free DNA templates
RNA probes for in situ hybridization were transcribed with an in vitro transcription reaction. Each different cDNA probe construct inserted in a plasmid vector for in vitro transcription contained a T3, T7 or SP6 promoter. To transcribe each probe only from the desired cDNA (not from the whole vector) we cut our vectors and made linearized DNA templates.
To prepare RNase-free DNA templates, approximately 20 mg of plasmid construct were digested, containing cDNA for probe, with the desired restriction endonuclease (Fig. 1) using 100 mL reaction volume. This amount was enough to enable labeling at least 10 times.
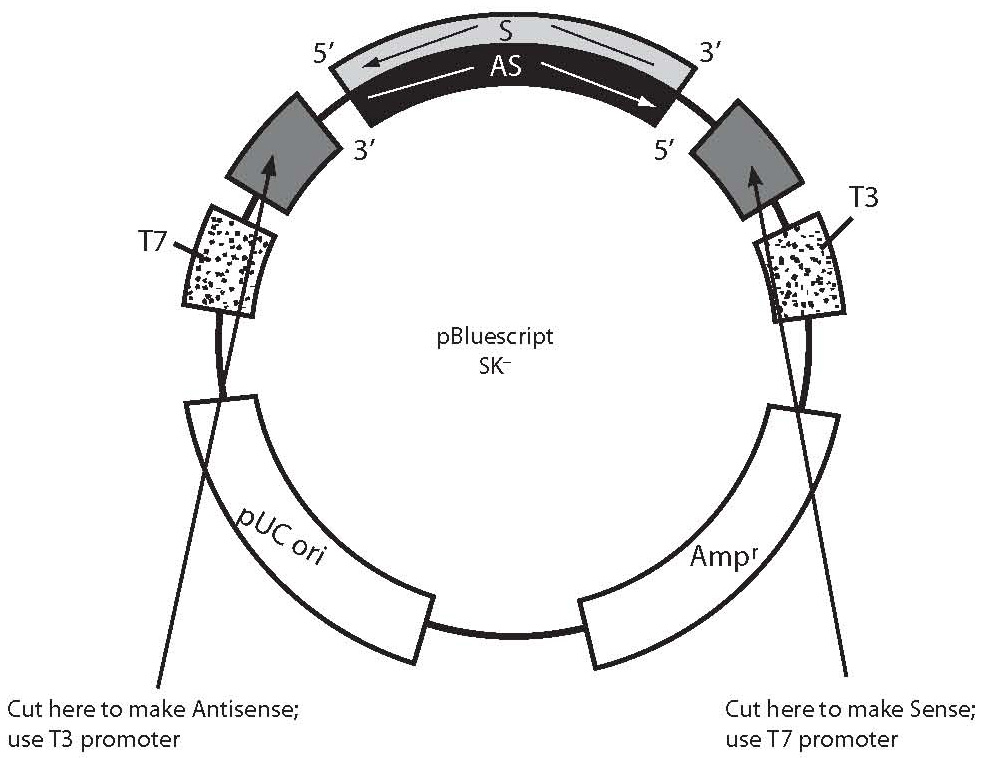
Figure 1. This figure is an example how to generate antisense and sense RNA probes transcribing cDNA template from a plasmid construct. The portion of the plasmid construct colored light grey (S-labeled is sense strand, sequence same as mRNA) and black (AS-labeled is antisense strand, sequence complementary to mRNA) represents cDNA probe insert cloned in polyclonal site of plasmid (dark gray). Bluescript plasmid has T3 and T7 polymerases (dots), which utilization can transcribe sense or antisense RNA probes using cDNA insert as probe template. To localize mRNA in tissue, we would generate an antisense RNA probe which is complementary to mRNA sequence (sense). Sense probes can be used for control. In order to generate an antisense RNA probe, the plasmid should be cut with an appropriate restriction enzyme close to the 5’ sense strand (light grey) of cDNA insert prior to transcription. Cutting the plasmid will limit cDNA insert transcription only, excluding vector sequences. The new antisense RNA probe can be synthesized from the 3’ end of the sense cDNA strand (light grey) as template using corresponding polymerase (T3, in this example). To generate a sense RNA probe, plasmid DNA should be cut with another appropriate restriction enzyme close to 3’ end of sense cDNA strand (light grey) and can be synthesized from 3’ end of the antisense cDNA strand (black) as template, using corresponding polymerase (T7, in this example).
Linearized templates were extracted with TRIS-HCl saturated phenol, pH = 8 (RNase free) and chloroform isoamyl alcohol (49:1), at a ratio of 1:1, twice, and once with chloroform only. The aqueous phase was precipitated with 3 M sodium acetate, pH = 5.5 (final molarity of 0.3 M sodium acetate) and 3 volumes of 100% ethanol overnight at -20 ˚C. The DNA pellet obtained by centrifugation was washed with ice cold 70% ethanol (diluted with RNase free water from 100% ethanol). The air dried pellet was dissolved in 20 mL 10 mM TRIS (pH = 7.5) (RNase free) and stored at -20 ˚C until later use. The measured concentrations of templates for probes were between 0.5 and 1.5 mg/mL.
Preparing the antisense and sense mRNA probes for in situ hybridization
For each probe, we used standard in vitro transcription reaction with digoxigenin UTP (16). Our prepared transcription mix contained: 1 µL RNase inhibitor (40 U/µL), 3 µL RNase free, DEPC (diethyl pyrocarbonate, Sigma) treated H2O (17), 4 µL 5X SP6 or T3, T7 polymerase buffer (Promega or Roche), 2 µL DTT (10X) 0.1 M (Promega or Roche), 6 µL 10 mM ATP, CTP and GTP (10X) 2 µL of each, 1.3 µL 10 mM UTP (10X), 0.7 µL DIG-11-UTP (10X, Roche), total volume 18 µL. In this transcription mix, 1 µL of RNase free DNA template and 1 µL of SP6, T3 or T7 polymerase were added following incubation at 37 ˚C for 1 hour. The untranscribed DNA template was removed using 2 µL of DNase (Roche) in 27 µL of DNase buffer (40 mM TRIS, pH = 7.5; 6 mM MgCl2; 10 mM NaCl) and 1 µL RNase inhibitor for 30 min at 37 ˚C. The reaction was terminated with 5 µL 0.2 M EDTA, pH = 8. At this point, the total volume of our transcribed probe was 55 µL. Final purification of RNA probe was done with precipitation with 1 µL glycogen (20 mg/mL, Roche), 5.6 µL 3 M Na-acetate and 200 µL (pre-chilled, -20 ˚C) 100% ethanol at -20 ˚C overnight. The probes were centrifuged for 30 minutes at 4 ˚C. The pellet was washed in 1.0 mL of ice cold (-20 ˚C) 70% ethanol, centrifuged for 10 minutes at 4 ˚C and air dried. Probes were dissolved by adding 200 µL RNase free H2O, with 2 µL RNase inhibitor (to preserve RNA) and heated at 37 ˚C, vortexing several times during 20-min incubation. RNA probes were confirmed by electrophoresis on 5% polyacrylamide gels containing 15 M urea, or by Northern analysis, with RNA markers, using 1 µL of transcribed probe. Probes were quantified using DOT blot for Estimating the Yield of DIG-labeled RNA. Probes were stored at -70 ˚C in aliquots of 0.5 or 1 µg each.
The probes larger than 1 kb were hydrolyzed for better penetration into the tissue (18). For hydrolysis of RNA probes, we used RNase free alkaline Hydrolysis Buffer 0.2 M (80 mM Na2HCO3/120 mM Na2CO3), pH = 10.2. Incubation time for hydrolysis was calculated using the equation:
T = L0 – Lf / L0 × Lf × K,
where T is time in minutes; Lo, initial length of probe in kb; Lf, desired length of probe in kb (we used: 200 bp);
K = 0.11 (strand scissions/kb per minute); example:
K = 0.11 (strand scissions/kb per minute); example:
1 kb - 0.2 kb / 1 × 0.2 × 0.11 = 0.8kb / 0.022 = 36 min.
Hydrolysis reaction was performed (if needed) after digestion with DNase and before final purification of probe with ethanol precipitation. We used equal volume of labeled RNA probe (50 mL) and hydrolysis buffer (50 mL) at 60 ˚C adjusting time by calculating the above equation. The hydrolysis reaction was stopped with 1/10 (10 mL) of the volume of Na-acetate pH = 5.5 and 1/20 volume (5 mL) 10% glacial acetic acid (diluted with RNase free water), following precipitation with 3 volumes (300 mL) of 100% ethanol, the same as described above in Final Purification of RNA probe, adjusting procedure for larger volumes.
Quantification of digoxigenin labeled RNA probes
Before storage at -70 ˚C, the RNA probes were quantified using “DOT” blot on a positive charged nylon membrane (Fig. 2). All digoxigenin labeled probes and control digoxigenin labeled RNA were serial diluted to 1:10, 1:100, 1:1,000 and 1:10,000. One mL of each dilution was dropped on the nylon membrane and fixed with a UV transilluminator. First, the filter was washed briefly in Buffer 1 (100mM TRIS-HCl, 150 mM HCl, pH = 7.5), and 5 minutes in Buffer 2 (buffer 1 + 2% blocking reagent, Roche), then treated with anti-digoxigenin antibody-alkaline phosphatase conjugate (Roche), diluted 1:5000 in Buffer 2. Next, we performed two washes for 5 minutes each in Buffer 1 and two minutes in Buffer 3 (100 mMTRIS - HCl, 100 mM NaCl, 50 mM MgCl2, pH = 9.5). For alkaline phosphatase color development, during 30 minutes at room temperature, we used 0.4 mL fresh diluted NBT/BCIP Stock Solution (Roche) or 90 mL NBT Solution (Roche) and 70 mL BCIP (Roche) in 20 mL of buffer 3.
Using the procedure described above, most of our probes were of the same concentration as the control probe after labeling. The control probe was 0.1 mg/mL. We made aliquots of 10 mL (1 mg) in each tube for all probes. The aliquoted probes were stored at -70 ˚C for up to one year for future experiments. For the experiment, we added 1 mL of hybridization solution on each aliquot.
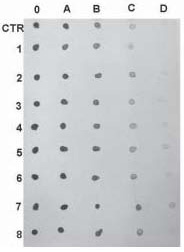
Figure 2. Quantification of digoxigenin labeled probes using dot blot and control labeled RNA from Roche. Dots labeled as 0 represent undiluted probes. A, represents 1/10; B, 1/100; C, 1/1000 and D, 1/10000 dilution of probes. The concentration of control probe is 0.1 µg/mL. In this example our labeled probes (1-8) have a similar concentration as the control probe (CTR).
Preparation of histologic sections
Bone, tooth and soft tissues were dissected, kept on ice and fixed in fresh 4% paraformaldehyde overnight at 4 °C (19). After demineralization in 15% EDTA pH = 7.5, and 0.5% paraformaldehyde for 6 weeks at 4 °C, bone and tooth samples were dehydrated (soft tissue samples were dehydrated the next day without demineralization) in increasing concentrations of methanol (25%, 50%, 80%, 100%-twice) on ice, each change for 1 hour. The sections were embedded in paraffin at 56 °C with 3 paraffin changes one hour each. Higher temperatures and longer incubation times can interfere later with immunocytochemistry if required after in situ. All timings in this procedure were adjusted for tissue pieces not bigger than 5 mm in diameter. For larger tissue pieces, longer times in procedure are required. All solutions used were purchased RNase free, or treated with DEPC (17). To spread the sections for mounting on slides, we used RNase free water (DEPC treated) preheated at 50 ºC since the paraffin we used has the melting point at 52 ºC. We used pre-cleaned and pretreated slides from Fisher Scientific, which gave us very low background and optimal tissue attachment: ProbeOn Microscope slides or Superfrost/Plus Microscope slides. After mounting, the slides were shaken by hand until all water droplets were removed between the section and tissue. Slides were left in a rack perpendicular to surface of heater set at 55 ºC overnight. The sections were stored in boxes at +4 ºC with desiccant and will retain an in situhybridization and immunocytochemistry signal for years. For better attachment prior to in situ hybridization, the night before the slide sections are laid horizontally on a headed plate set at 55 ºC until the next morning (for immunocytochemistry this is omitted). Sections treated with the extra heated incubation preserve mRNAs and the sections remained better attached on slides throughout the in situ hybridization procedure.
Methods 1, 2 and 3: non-radioactive in situ hybridization; procedures using digoxigenin labeled probes
The non-radioactive in situ hybridization was performed using procedures developed in our laboratory plus methods from others using digoxigenin probes as described (7,20). Prior to hybridization, sections were de-paraffinized with xylene and 100% ethanol following re-hydration with 50%, 75% and 95% Ethanol and PBS (diluted with RNase free water). After treatment with proteinase K solution (Proteinase K, 5 mg/mL in 50 mM TRIS, 5 mM EDTA pH = 7.6) for 10 minutes at 37 °C, sections were re-fixed in 4% formaldehyde in PBS (0.2 M phosphate buffer, 0.3 M NaCl), acetylated (100 mM triethanolamine, 0.25% acetic anhydride) and pre-hybridized in 2XSSC. Hybridization was performed at 55 °C overnight, in the hybridization solution containing 50% formamide, 20 mM TRIS-HCl (pH = 8.0), 1 mM EDTA, 0.3 M NaCl, 10% Dextran sulfate, 1X Denhardt solution, 100 µg/mL denatured sheared Salmon Sperm-DNA, 500 µg/mL tRNA) and 1 mg/mL DMP1 UTP-digoxigenin labeled RNA probe. After hybridization, the parafilm cover slips were removed in 5XSSC at room temperature and sections were washed in 50% formamide, 5XSSC and 1% SDS solution at 55 °C two times for 30 minutes. Next, the sections were incubated with RNase (40 mg/mL RNase A1 and 10 U/mL RNase T1) in RNase buffer solution (0.3 M NaCl, 10 mM TRIS, 5 mM EDTA) at 37 °C for one hour, followed by incubation in the same buffer without RNase for 30 minutes. Consecutive washes at 55 °C were done twice with 50% formamide and 2XSSC for 30 minutes, and three times for 5 minutes each at room temperature in TBST (100 mM TRIS pH = 7.5, 150 mM NaCl, Tween-20 0.1%). At this point, slides were ready for detection of hybridization signal with three different methods:
Detection of in situ hybridization signal
Method 1: Alkaline phosphatase detection
After washing, the sections were soaked for 1 hour at room temperature in blocking mix: 1% blocking reagent-(Roche), fresh diluted in maleic acid buffer (100 mM Maleic Acid, 150 mM NaCl, NaOH solid or 10N to adjust pH = 7.5). Anti-Digoxigenin-AP-Fab fragments (Boehringer Mannheim or Roche) were diluted for bone morphogenetic protein 2 (BMP2), osteocalcin (OC) and osteopontin (OPN) probe 1:50, for collagen 1a1 (Col1) probe 1:500 in blocking mix and was added after post-hybridization washing and incubating for overnight incubation at 4 °C. Next day, the sections were washed using TBST for 5 minutes, wash buffer (100 mM Maleic acid, 150 mM NaCl, Tween-20 0.1%, 2 mM Levamisole) twice for 15 minutes, and pre-detection buffer (100 mM TRIS pH = 9, 100 mM NaCl, 2 mM Levamisole) for 5 minutes. Detection of hybridization signal was done according to De Block et al.(21) by adding alkaline phosphatase substrate (NTB/BCIP, Boehringer Mannheim or Roche) or NTB (Boehringer Mannheim or Roche) and BICP (Roche) in detection buffer (10% polyvinyl alcohol 70-100 kd-Sigma, 100 mM TRIS pH = 9, 100 mM NaCl, 2 mM, 50 mM MgCl2, 2 mM Levamisole), to inhibit endogenous alkaline phosphatase, and 10 mM N-ethyl maleimide to inhibit ”nothing dehydrogenase” reaction (22). The duration of hybridization signal development was from 1 hour to overnight at 30 °C, depending on the probe. When detection of hybridization signal was completed the sections were washed in warm water 3 x 5 minutes (can be left in water for few days at +4 °C) and counterstained with methyl green or nuclear fast red for 5 minutes, dehydrated in ethanol, washed in xylene and permounted.
Method 2: Tyramide signal amplification and alkaline phosphatase detection
In situ hybridization was done as for method 1, only quenching of endogenous peroxidase step (3% H2O2 in PBS for 60 minutes) was added before proteinase K digestion followed by three 3x5 minutes washes with PBS. This step was necessary to minimize background, since activation and covalent binding of DNP Amplification reagent is catalyzed by horseradish peroxidase (HRP).
For this detection we used in situ TSA plusDNP-AP system from PerkinElmer. After post hybridization washing, the sections were soaked for 30 minutes at room temperature in TNB blocking reagent: 0.5% blocking reagent-PerkinElmer (or provided in kit), fresh made or stored at -20 °C in TNT buffer (100 mM TRIS pH = 7.5; 150 mM NaCl; 0.05% Tween-20). Anti Digoxigenin-POD (Poly) Fab fragments antibody (Boehringer Mannheim or Roche) was diluted 1:50 in blocking reagent, and incubated overnight at 4 °C following 3 x 5 minute washes in TNT. Next step was 3- to 10-min incubation in Tyramide Signal Amplification reagent (dilution from stock 1:50 in 1x Amplification Diluent, both supplied in kit), following 3 x 5 minute washes in TNT. After these washes, the sections were incubated in pre-detection buffer (100 mM TRIS pH = 9, 100 mM NaCl, 2 mM Levamisole) for 5 minutes. Detection of hybridization signal was done as in method 1. Duration of hybridization signal development was 10 minutes to 1 hour at 30 °C, depending on the probe. Sections were counterstained and permounted as in method 1.
Method 3: Tyramide signal amplification and cyanine 5 fluorescence detection
In situ hybridization was done the same as for method 1, only quenching of endogenous peroxidase step was added before proteinase K digestion followed by three 3 minute washes with PBS, as described in method 2.
For this detection, we used in situ TSA PLUS Fluorescence system from PerkinElmer. After post hybridization washing, the same as in method 2, the sections were blocked for 30 minutes at room temperature in TNB blocking reagent. Anti Digoxigenin-POD antibody was diluted 1:50 in blocking reagent, and incubated overnight at 4 °C following 3 X 5 minute washes in TNT. Incubation for 3-10 minutes in Tyramide Signal Amplification reagent (supplied in kit) was followed by 3 x 5 minute washes in TNT. After these washes, the sections were permounted in Vector shield fluorescent mounting media and viewed with a confocal microscope (Excitation 648nm, Emission 570 nm).
Quantification of hybridization signal with ImageJ
ImageJ is a public domain, a Java based image processing program developed at the National Institutes of Health (NIH), USA. The ImageJ software is freely available for Microsoft Windows, Mac OS, Mac OS X, Linux, Sharp Zaurus PDA and can be downloaded if logged on: http://rsb.info.nih.gov/ij/download.html.
This software has been designed with an open architecture that provides extensibility via Java 1.1 version or later versions, using plugins and recordable macros. Custom acquisition, analysis and processing plugins can be developed using ImageJ’s built-in editor and a Java compiler. User-written plugins make it possible to solve many image processing and analysis problems, from 3-dimensional live-cell imaging to radiological image processing, multiple imaging system data comparisonsto automated hematology systems.
For quantifying in situ hybridization signal, we used a purple-blue color from NBT formazan, which is a generated product of alkaline phosphatase reaction using BCIP and NTB substrate. The counterstain should be very light in order not to interfere with the mRNA signal. Before using ImageJ, the area, minimum and maximum grey area, and mean grey value can be selected in Set Measurements under Analyze. We used the tool “free hand selections” surrounding areas for measurements. All measurements were read clicking on Measure under Analyze. All areas measured for a hybridization signal were corrected for background reading. To define background, 5 areas without hybridization signal were selected and averaged, then subtracted from the signal value. All obtained numbers are relative.
Method 4: Radioactive in situ hybridization and signal detection
The radioactive in situ hybridization was extensively performed using procedures developed in our laboratory and described by Gluhak-Heinrich et al. (23). Hybridization was performed with 32P rUTP labeled collagen 1a1 (Col1) and Osteocalcin (OC) RNA probes.
Results
The aim of this study was to develop and determine the power of our non-radioactive in situ techniques in comparison to our well established and widely used radioactive method (23) using paraffin sections. As a novel approach to prove usefulness of our newly developed methods in a variety of applications, especially paraffin sections, we also showed the possibility of quantification of non-radioactive hybridization signals. To test this, we used de-mineralized tissue sections with bone, tooth and soft tissues. First we developed and optimized three different procedures of non-radioactive in situ hybridization methods. Second, we analyzed the expression of Col1 and OC mRNA in sections of mouse alveolar bone adjacent to first molars using our routine radioactive in situanalysis (Figure 3). Third, we determined the expression of Col1, OC and Osteopontin (OP) mRNA using a non-radioactive approach (Figure 4). We used exactly the same templates of our cDNAs to transcribe 32P or digoxigenin labeled RNA probes. The Col1 and OC mRNA expression in alveolar bone and tooth were compared and quantified. To prove that our non-radioactive in situhybridization method 2 is as sensitive as our radioactive method in soft and bone tissue, we tested three different non-radioactive methods and radioactive method with three different probes: BMP2 (very low mRNA copy number), Col1 (very high mRNA copy number) and OP (medium copy number and specific for osteocytes).
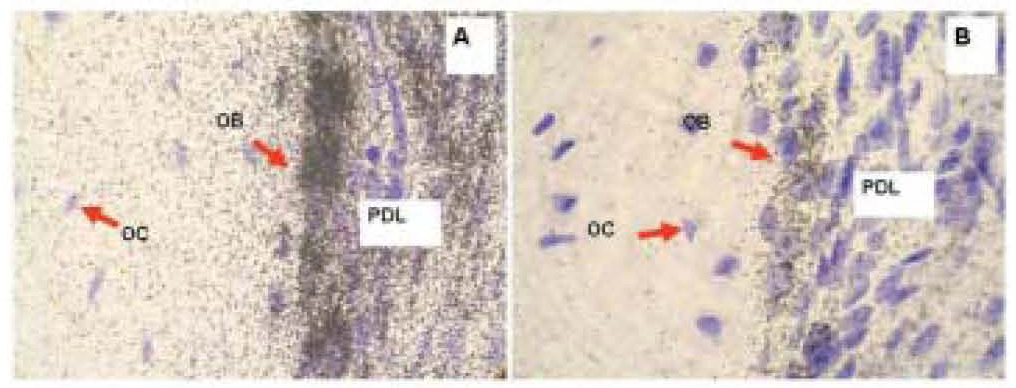
Figure 3. Radioactive in situ hybridization of Collagen 1a1 (A) and Osteocalcin (B) in representative sections of mouse maxilla. Positive hybridization signal is represented with silver grains, black dots over tissue. Purple color is counterstained using hematoxylin. The signal above the background is the highest in osteoblasts for both Collagen 1a1 and Osteocalcin probes. Note that the hybridization signal is more abundant for collagen than for osteocalcin. PD, periodontium; OB, osteoblasts; OC, osteocytes.
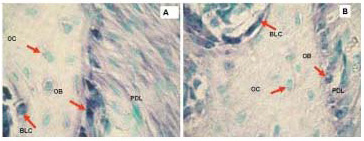
Figure 4. Non-radioactive in situ hybridization performed with digoxigenin labeled probes, Collagen 1a1 (A) and Osteocalcin (B) in representative sections of mouse maxilla. Positive hybridization signal is represented with blue stain. Green color represents methyl green staining as counterstain. The signal is highest in osteoblasts for both Collagen 1a1 and Osteocalcin probes but there is also some signal in PDL and bone lining cells. Osteocytes are not expressing collagen or osteocalcin in these sections. Note also that the hybridization signal is more abundant for collagen than for osteocalcin. PD, periodontium; OB, osteoblasts; OC, osteocytes, BLC, bone lining cells.
In developing our in situ procedures, we first tested different parameters for optimal performance. The results of this testing are described below, but in situ pictures of these numerous testing are not shown because a large space would be needed.
We started our testing with optimum preparation of bone tissue. This is crucial since in situ hybridization always begins with fixation of the tissue or cells, which should preserve mRNA within the cells and morphology of tissue. The paraformaldehyde fixation with EDTA treatment should be RNase free from the beginning. We also found that 8-micron thick sections were optimal for our methods: thicker sections can be used and thickness may give us more hybridization signal, but resolution will decrease if pictures are taken on high magnification and they may not stay adhered to the slides throughout the hybridization procedure.
Best results for linearizing DNA probes with restriction endonucleases were obtained with enzymes cleaving producing 5’ overhangs or blunt ends. The results were also better if probes, after digoxigenin labeling and before aliquoted for storage, were vortexed and heated in RNase free 10 mM TRIS pH = 7.6 at 65 ˚C for 20 minutes and/or the addition of SDS to 0.1% to aid solubility of probes.
We obtained optimal signal and low background with 5 ml of probe per 1 cm2 of slide used for hybridization, with all digoxigenin labeled probes at a concentration of 1 µg in one mL of hybridization solution. Use of more solution with more probe per mm2 on the slide or more concentrated probe gave us higher background. We found that the accurate probe concentration estimation can be obtained by gel electrophoresis and ethidium bromide staining comparing aliquots of the DIG labeled probe RNA with a standard RNA of known concentration (one is supplied with the kit for DIG labeling) or by comparing dot blots of a dilution series of labeled RNA probe and labeled RNA standards (Fig. 2).
For radioactive hybridization, we estimated the amount of probe used by gel electrophoresis and ethidium bromide staining with an RNA standard of known concentration. The concentration of probes we used was 100-500 ng/mL of hybridization solution and on slides we added 80 ml (10 ml per 1 cm2). Regarding probe length, our experiments showed that probes of up to 1 kb were not a problem for penetration in the tissue with non-radioactive in situ, but for radioactive in situ all probes were hydrolyzed to average length of 150-250 bp to obtain optimal signal.
On testing for tissue permeability, our non-radioactive method showed good results with: 5 mg/mL of Proteinase K. This concentration was previously tested for our well established radioactive method (23). After experiments with different concentrations of Proteinase K, we obtained best results using the same concentration as we used for radioactive in situ, since concentrations higher than 10 mg/mL of Proteinase K destroyed morphology and increased background.
In our previous and parallel studies working with radioactive in situ hybridization, we analyzed digestion with RNase during washing steps and its effect on background. We found that 40 mg/mL RNase A to be optimum. This amount gave us lowest background and higher amounts had little influence on background. The great difference in decreasing background in situ hybridization was the addition of RNase T1 up to 10 U/mL. This testing was done with radioactive in situ and it was adopted for non-radioactive showing very clear low background.
We tested different dilutions of anti-digoxigenin antibodies. The best results for high abundant genes were at 1:500 dilution but for probes used for detection of few mRNA targets the optimal dilution was 1:50.
The length of time with developing color solution with alkaline phosphatase enzymatic reaction was tested extensively. We found developing time for Col1 probe to be one hour, OC and OP probes needed 6 hours, and for BMP2 probe as a very low abundant mRNA target we needed overnight development using method 1. These conditions are for dilution of anti-DIG-Antibodies 1:50. The more diluted antibodies, the longer the time of development needed. Using method 2, all probes developed between 10 minutes to 1 hour, since the signal was amplified (results not shown). Our results showed that development longer than 20 hours usually resulted in higher background than acceptable.
Quantification of in situ hybridization results obtained with Col1 and OC
As shown in Figures 4 and 5, visibility of non-radioactive hybridization signal is detectable at different levels. The highest intensity of hybridization signal was detected in odontoblasts (OD) with Col1 probe (Fig. 5A). The lowest signal was detected in osteoblasts (OB) with Col1 probe (Figs. 5B and 6B). After quantification, the hybridization signal of highest intensity was measured with ImageJ as 95% (100% is black) and the lowest detected in this experiment was 23% (0% is white). The other two middle expression levels are: signal in odontoblasts (OD) obtained with OC (80%) and signal in osteoblasts (OB) from Col1 (45%). Similar sections hybridized with the same probes, Col1 and OC, labeled with radioactivity showed the same expression pattern of Col1 and OC represented with distribution of silver grains as hybridization signal (Fig. 1). Using this radioactivity method, the localization of signal at the cell level was not as clear as with non-radioactive localization.
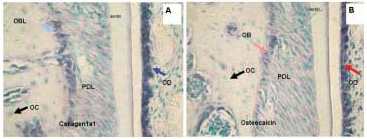
Figure 5. Different intensity of hybridization signal obtained with non-radioactive digoxigenin labeled in situ hybridization of Collagen 1a1 (A) and Osteocalcin (B) in representative sections of mouse maxillary alveolar bone and part of the first molar. The blue stain represents positive hybridization signal and green represents counterstain. The signal is highest in Collagen 1a1 labeled odontoblasts followed by lower intensity but still very high signal in osteocalcin labeled odontoblasts. The middle intensity of hybridization signal is in osteoblasts hybridized with Collagen 1a1. Well visible but the lowest hybridization signal intensity was detected in osteoblasts hybridized with the osteocalcin probe. The bone lining cells are also highly labeled. Osteocytes are not expressing collagen or osteocalcin in these sections. Note also that the hybridization signal is more abundant for collagen than for osteocalcin in both odontoblasts and osteoblasts. PD, periodontium; OB, osteoblasts; OC, osteocytes, BLC, bone lining cells, OD, odontoblasts.
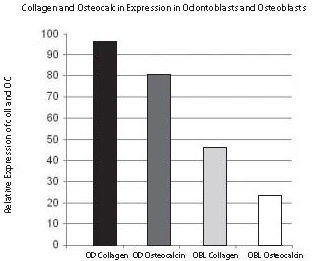
Figure 6. Quantification using ImageJ of different levels of hybridization signal intensities was obtained with non-radioactive in situ hybridization. The relative expression of Collagen 1a1 (A) and Osteocalcin (B) mRNA from Figure 5 was quantified in odontoblasts and osteoblasts. The black bar in the graph represents almost the highest possible (95%) hybridization signal which was obtained with Collagen 1a1 mRNA in odontoblasts and marked with the dark blue arrow as in Figure 5. The osteocalcin mRNA expressed in odontoblasts labeled with a dark gray bar in the graph and a red arrow in Figure 5 represents a still very high hybridization signal (80% of maximal signal), although lower than previously in odontoblasts labeled with Collagen 1a1. The next light gray bar in the graph showing 45% of maximum hybridization signal is represented with Collagen 1a1 expression in osteoblasts and labeled with a light blue arrow in Figure 5. The still highly visible (23% of maximum signal) hybridization signal is shown with a white bar graph representing osteoblasts hybridized with a osteocalcin probe and marked with light a red arrow in Figure 5. Note the good correlation of relative hybridization signal, blue color in Figure 5 with the possible range of ImageJ quantification in Figure 6.
Sensitivity of non-radioactive in situ hybridization methods
To test sensitivity of our non-radioactive in situ hybridization methods with radioactive in situ using tooth and alveolar bone tissue, we performed hybridization with three different non-radioactive methods and the radioactive method using three different probes: BMP2, Col1 and OPN. The BMP 2 probe was used as a representative for localizing one of the lowest abundant mRNAs in the bone. The best hybridization signal, with non-radioactive in situ, was obtained with method 2 using BMP2 digoxigenin labeled probe with Tyramide Signal Amplification and alkaline phosphatase detection (Fig. 7B). The intensity of this BMP2 signal was comparable with method 4-radioactive in situ hybridization (Fig. 7D and 7E). Localization of BMP2 mRNA transcripts with Tyramide Signal Amplification and Cyanine 5 fluorescence detection, method 3, showed minimal BMP2 hybridization signal (Fig. 7C). Non-radioactive in situ using alkaline phosphatase detection without amplification, method 1, did not show any hybridization signal for BMP2 (Fig. 7A). This method 1 was not sensitive enough to label rare BMP2 mRNA transcripts.
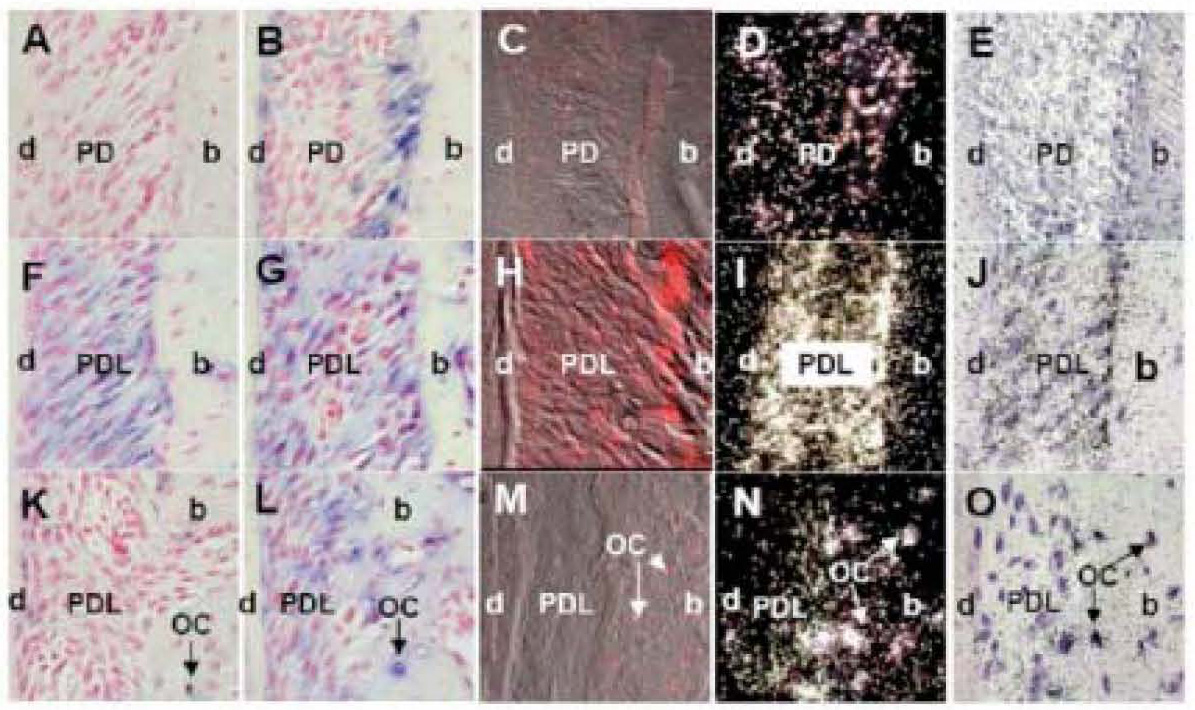
Figure 7. The representative sections of mouse maxilla showing BMP2-Bone Morphogenetic Protein 2 (A-E), Col1-Collagen 1a1 (F-J) and OP-osteopontin (K-O) mRNA expression performed with four different in situ hybridization methods: 1) non-radioactive in situ using digoxigenin labeled probes with alkaline phosphatase detection (A, F, K); 2) non-radioactive in situ using digoxigenin labeled probes with Tyramide Signal Amplification and alkaline phosphatase detection (B, G, L); 3) non-radioactive in situ using digoxigenin labeled probes with Tyramide Signal Amplification and Cyanine 5 fluorescence (C, H and M); and 4) radioactive in situ using 32P labeled probes and autoradiography detection (D, I and N, darkfield images; E, J and O, bright field images).
In non-radioactive in situ hybridization with alkaline phosphatase detection (methods 1 and 2), positive hybridization signal is represented with blue stain and red color is counterstain from nuclear red (A, B, F, G, K and L). In non-radioactive in situ hybridization using fluorescence of Cyanine 5 as detection (method 4), positive signal is represented with bright red color (C, H and M). The white silver grains represent positive hybridization signal in autoradiographs of radioactive in situ hybridization (method 3) using dark field images (D, I and N), and black silver grains using bright field images (E, J and O).
The best hybridization signal for BMP 2 probe was obtained with (method 2) non-radioactive in situ using digoxigenin labeled probes with Tyramide Signal Amplification and alkaline phosphatase detection (B) and (method 4) radioactive in situ hybridization (D, E). Note advantage of non-radioactive localization of BMP2 mRNA at the level of cells (B), compared to the radioactive one (D, E). Localization of BMP2 mRNA transcripts with Tyramide Signal Amplification and Cyanine 5 fluorescence (method 3) showed minimal BMP2 hybridization signal (C). Non-radioactive in situ using alkaline phosphatase detection without amplification (method 1) did not show any hybridization signal for BMP2 (A).
Col1 probe hybridization signal was localized with all four in situ methods (F-O).
The hybridization signal for OP in osteocytes was also found with all four in situ methods (F-O).
Labeling description: d, dentin; PD, periodontium; b, bone; OC, osteocytes.
The Col1 probe was used as a positive control since it represents one of the most abundant mRNAs in bone. The hybridization signal of Col1 was localized with all tested in situ methods with great intensity (Fig. 7F to 7O).
OP probe was used as a marker for osteocytes, bone cells embedded in the matrix. This gene is much less abundant in bone than Col1, but much more than BMP2. The hybridization signal for OP in osteocytes was also found with all the in situ methods tested (Fig 7F to 7O).
Discussion
We have developed a high sensitive in situ hybridization method at a level with radioactivity, with identifying steps which are critical for localization of low copy number mRNAs in de-mineralized paraffin embedded tissue with almost nonexistent background and possibility of quantification. Up to date, quantification for non-radioactive in situ hybridization using image analyzer has been published, yet only by Japanese authors (24), while the one for radioactive in situ was published 22 years ago (25).
To test the power of this technique, we chose probes that label bone cells in teeth and soft tissue. Such probes include Col1 known to be abundant, whereas OC and OP are found at a lower copy number, but BMP2 are found in a very low copy number compared to Col1 in the same tissue. To achieve high sensitivity required for low-abundance mRNAs, we optimized crucial steps of hybridization and detection to achieve the best possible signal-to-noise ratio, comparable to radioactive in situ hybridization. All of these experiments were conducted on similar alveolar bone sections with bone, teeth and (periodontium) PDL as soft tissue. This allowed us easy and clear comparison of hybridization signal in the same cells and between radioactive and non-radioactive hybridization techniques.
Non-radioactive in situ hybridization steps identified to be crucial are:
1. quality of the fixed tissue;
2. probe labeling and determination of concentration;
3. penetration of the probe into the tissue;
4. appropriate dilution of Anti-digoxigenin antibodies; and
5. adequate length of developing color with enzymatic reaction.
Good quality of tissue for in situ hybridization preserves the integrity of target mRNA in the tissue using RNase free appropriate fixation which gives the best hybridization signal. Little fixation, however, can lead to loss of tissue and mRNA, and too much can cause extensive cross linking that may render the cytoplasm relatively impermeable to all probes.
All our protocols involve complete RNase free: pre-hybridization and hybridization reagents including dishes and any glassware which will be in contact with tissue before or during hybridization. Procedures have been described elsewhere (17). These RNase precautions are crucial since RNase contamination can completely destroy mRNA targets.
The preparation of probe is very important. Before transcription with digoxigenin, plasmids containing cDNA probe inserts should be linearized with appropriate restriction endonuclease enzyme to produce the cDNA probe sequence only. It is important that the restriction digestion be performed to completion. A small amount of undigested plasmid DNA can give rise not only to probe transcripts but also to very long whole plasmid transcripts which may incorporate a substantial fraction of digoxigenin labeled rNTP. This kind of labeled probe will not be specific and will not hybridize specific target mRNAs. Hybridization in situ labeling will be nonexistent or nonspecific. Similar results will exist if the template used for in vitro transcription does not carry protruding 5’ termini or are not blunt ended as reported by Schenborn and Mierendorf (26). For these reasons, we avoided using enzymes creating 3’ protruding termini such as: Aat II, Bgl I, Cfo I, Hha I, Pvu I, Sfi I, Apa I, Bsp 1286 I, Hae II, Kpn I, Sac I, Sph I, Ban II, Bstx I, HgiA I, Pst I and Sac II. If we could not find an appropriate enzyme and we digested with enzymes creating recessed 3’ protruding termini, these ends need to be filled-in by the polymerase activity of Klenow fragment of E. coli DNA polymerase I, in the presence of appropriate deoxynucleotides (dNTPs) (17). We think that other reasons that the transcription reaction fails or is poor are:
1. the cut plasmid DNA used as template for transcription is not pure enough, therefore re-extraction with phenol/chloroform and checking with a spectrophotometer for the concentration and purity needs to be done;
2. there is too much DNA in the transcription reaction, therefore less amount of DNA is needed; and
3. a wrong polymerase was used, therefore the correct one needs to be used.
Another problem can arise if the probe is not completely dissolved and resuspended. According to manufacturers, digoxigenin labeled RNA is slightly more difficult to work with than regular RNA and is probably due to hydrophobicity of the hapten making it less soluble. Because of this, phenol/chloroform extraction of DIG labeled RNA results in major losses and should be avoided; however, precipitates of DIG labeled RNA can sometimes be difficult to redissolve and may require heating to 65 ˚C for 20 minutes by vortexing, mixing, and/or the addition of SDS to 0.1%, to aid solubility.
In the in situ hybridization, the ability of the probes to permeate sections has a major effect on the strength of hybridization signal. To achieve the most efficient signal, three different techniques are used: with Triton, protease and Proteinase K (18, 27-29). From our experience, Triton is considered for frozen sections but for paraffin sections Proteinase K is the treatment of choice. We used 5 mg/mL for both methods (19). There is a dogma for in situ hybridization on sections that good penetration of the labeled RNA probe length should be short; thus, the optimum probe length is 50-150 base pairs (18). However, the labeled RNA probe can be treated with mild alkali to hydrolyze for optimum length (note that digoxigenin hapten is not destroyed by this treatment). However, we found that probe size reduction may not be so important in this hybridization procedure as long as the probe size is less than 1 kb (10).
In the existing protocols for non-radioactive in situ with digoxigenin, different dilutions of anti digoxigenin antibodies are used and this amount or dilution was not discussed. We found out that trying to detect few copies of target mRNA is impossible with a 1:5000 dilution of anti-digoxigenin antibodies (anti-DIG Fab fragments), as recommended in some in situ protocols. Detection of hybridization signal is greatly dependent upon the mRNA copies and dilution of anti-DIG Fab fragments. The manufacturer’s suggestion for in situ hybridization is 1:20 to 1:100 but most of the protocols use higher dilutions. Maybe the reasons for high background became a problem in some tissues with low antibody dilution and developing time longer than 1 hour. We also think that this is very important, during developing color more than 1 hour, to add 2 mM Levamisole, an endogenous alkaline phosphatase inhibitor as recommended before (27) and 10 mM N-ethyl maleimide (to inhibit ”nothing dehydrogenase” reaction) (22).
The amount of time for developing color reaction in digoxigenin in situ hybridization is very important for quantification. In order to do quantification, development of colors should be monitored closely since overdeveloping color can reach highest possible intensity and under-estimate the highest expressions in comparison with other lower mRNA expressions still developing color with time. Previously, in situ quantifications were done only with radioactive and fluorescent methods. Here we have shown that with our non-radioactive in situ hybridization method, we can quantify different levels of blue staining that represent different levels of mRNA expression, and compare this expression in the range of 0-100% or in an 8 bit format of 0 to 256. Up to date, this is the first non-radioactive in situ quantification protocol described.
Our results demonstrate a similar in situ hybridization pattern with radioactive and non-radioactive in situ hybridization as reported previously (30). Our non-radioactive in situ hybridization method 2 shows hybridization signal, of very low abundant BMP2 mRNA, as signal efficient as the radioactive method. We think that digoxigenin labeled probes (or other hapten labeled probes) are superior compared to radio-labeled for each experiment, due to the probe stability and possibility of its storage for many months (31). Other advantages of non-radioactive probes are the faster turnaround time of achieving results, and few days for digoxigenin procedure compared to 3 weeks for the radioactive procedure (30). Another advantage is spatial resolution of the enzyme detection using non-radioactive procedures as being much better than can be obtained with radioactivity, allowing for more precise target sequence localization (see Figs. 3, 4, 5 and 7). Furthermore, all tested non-radioactive hybridization techniques show unique expression at the level of single cell without background. The non-radioactive procedures described herein have been tested by several other probes with great success (Fig. 7). We localized BMP2 mRNAs, known as one of the very rare in bone, using method 2 (Fig. 7B), with intensity of radioactive in situ (Fig. 7D and 7E). Using the same probe, we localized BMP2 in the same tissue with very low intensity, with method 3 (Fig. 7C) but with method 1, BMP2 was not localized (Fig. 7A). Sensitivity of method 2, equivalent to radioactive method (method 4) is achieved with two technical steps. One step is the addition of polyvinyl alcohol (PVA) used as color development enhancer during alkaline phosphatase detection reaction, where BICP (AP substrate) after de-phosphorylation gives dark-blue indigo-dye as an oxidation product further intensified with oxidation of NTB, another component of AP substrate. PVA prevents diffusing of dark-blue indigo-dye as AP reaction product and this is what enhances the color signal. The second step is the use of TSA (Tyramide Signal Amplification) that significantly enhances chromogenic and fluorescence signals. For in situsignal detection, TSA technology uses horse radish peroxidase (HRP), attached to anti digoxigenin antibodies bound to digoxigenin labeled probes localizing mRNA, to catalyze the deposition of dinitrophenyl (DNP) labeled amplification reagent adjacent to the immobilized HRP enzyme. These DNP labels can then be indirectly detected using anti-DNP-Alkaline Phosphatase antibodies and finally AP enzyme color detection. Fluorescent method 3 also uses TSA technology. With this method, we obtained an in situ hybridization signal using the BMP2 probe, relatively low abundant message in bone. Signal intensity using method 3 was lower than using method 2. Reason: method 3 uses fluorescent detection rather than AP. The fluorescent method 3 also uses TSA reagent but directly labeled with fluorophore simplifying the detection for immediate visualization via fluorescence microscope. AP enzyme detection for method 2 is more sensitive than fluorescence since after TSA reagent final detection is indirect, using additional anti-DNP-Alkaline Phosphatase antibodies and PVA development AP color enhancement lasting from 30 minutes to overnight, both additionally increasing sensitivity. With method 1 we did not localize BMP2; this method uses sensitive color AP enzyme detection but does not use TSA amplification which enhances in situ signal significantly. Our estimation is that non-radioactive method 2 is at least 10 times more sensitive than non-radioactive method 1 and 3-5 times more sensitive than method 3. The advantage of non-radioactive localization of BMP2 mRNA with method 2 is signal at the level of the cells (Fig. 7B), compared to radioactive one (Fig. 7D and 7E). The reason for non-precise localization of radioactive signal at the cell level is spreading high 32P energy to surrounding areas, effecting exposure of photograph emulsion used for hybridization signal detection. Result is a lot of scattered silver grains, at and around the source of radioactive hybridization signal, which enables detection at the single cell level.
Our final in situ hybridization technique testing used osteopontin (OP) probe as a relatively abundant mRNA marker for osteocytes, i.e. bone cells embedded in matrix. Using this probe, we localized signals in osteocytes with all non-radioactive methods (Fig. 7K, 7L and 7M). Obtained signal intensity was comparable to the radioactive method (Fig. 7N and 7O) and provided final proof of usefulness of our non-radioactive in situ hybridization methods in a variety of cells and tissues.
We feel that the use of these non-radioactive in situ hybridization analyses with our new quantification protocol offers greater potential for novel biological insights in many fields including research and clinical chemistry.
Acknowledgements
This study was supported by the National Institutes of Health research grants NIDCR R03 DE16949 and AR46798.