Introduction
Blood glucose monitoring devices provide us with instant feedback about approximate concentrations of blood glucose and are not supposed to be used for setting the diagnosis (1). Those devices are very easy to handle, small in size and very practical for general use. However, it has been reported that self monitoring blood glucose (SMBG) devices have questionable accuracy and low precision (2). The primary objective of this study was to evaluate Accu Chek Compact Plus blood glucometer by comparing its accuracy and precision to a laboratory reference system. Our preset acceptance criteria were: for precision: CV < 5%; for accuracy: bias < 10%.
Materials and methods
Subjects
Blood samples were obtained from a consecutive series of outpatients enrolled during September 2007, scheduled for their routine glucose measurement. Data on gender and age were collected for all patients. All patients consented to participate in this study.
Samples
Blood collection was done by a well trained laboratory phlebotomist. Whole capillary blood was collected by pricking the patient fingertip once and glucose measurement was done immediately on glucometer, from the first drop of blood. 500 μL of whole blood was then collected from each patient in a BD Microtainer® tube with NaF/Na2-EDTA additive (Becton Dickinson, Franklin Lakes, USA), centrifuged at 3500g for 10 minutes and blood glucose was assayed in plasma on Olympus AU 2700 referent laboratory instrument (Olympus, Tokyo, Japan).
Olympus AU 2700 chemistry analyzer
Glucose was assayed with original Olympus reagents (Olympus, Hamburg, Germany) employing reference method with hexokinase on Olympus AU 2700 analyzer (Olympus, Tokyo, Japan). The method is calibrated daily and Olympus control sera Olympus Control Level 1 i 2 (Olympus, Hamburg, Germany) are run on two levels (O1 = 5.4 mmol/L and O2 = 13.2 mmol/L) every eight hours or/and after 100 glucose tests. The glucose calibrators are traceable to the National Institute of Standards and Technology Standard Reference Material (NIST SRM 965). According to the manufacturer, the method is linear within the concentration from 0.6 to 45.0 mmol/L; the limit of detection is 0.04 mmol/L; intra-assay coefficient of variation (CV) for Olympus control specimens are 0.9% and 1.0% for O1 and O2 respectively and accuracy (bias) of the method is -0.2% and -0.4% for O1 and O2 respectively (3).
Accu Chek Compact Plus portable blood glucometer
Accu Chek Compact Plus portable instrument (Roche Diagnostics GmbH, Mannheim, Germany) employs method with glucose-oxidase measured by reflex photometry. As declared by the manufacturer, the method is linear within the range 0.6-33.3 mmol/L, detection limit is 0.6 mmol/L and the mean intra-assay CV is < 2% (4).
Statistical analysis
Each distribution was examined for normality by Kolmogorov-Smirnov test. The difference between Olympus and Accu Chek glucose concentrations was tested by paired t-test. Glucometer accuracy was evaluated using four methods and respective commonly used criteria: (a) By comparing SMBG system values with the reference value and expressed as bias (%); (b) Passing-Bablock regression; (c) Bland-Altman analysis; (d) Error Grid Clarke analysis (5).
Intra-assay precision of the glucometer was examined by 10 successive measurements from one random capillary whole blood patient sample and two commercially available Accu Chek control samples (Roche, Mannheim, Germany). Control values as declared by the manufacturer for Accu Chek were 3.3–5.0 and 8.8–11.9 mmol/L for K1 and K2 control samples respectively.
Statistical analysis was performed with MedCalc® statistical software (MedCalc 9.3.3.0, Frank Schoonjans, Mariakerke, Belgium). P value < 0.05 was considered statistically significant. Error Grid Clarke analysis was done using Microsoft Excel (Microsoft Corporation, Santa Rosa, USA). Excel sheet with formulas and predesigned graph were generously obtained from prof. Michael P. Kane, Pharm.D., (Department of Pharmacy Practice, Albany College of Pharmacy).
Results
The study included 48 patients, with a median age 64 years (interquartile range 58–66) out of which 28 were females (58%).
Bias
Bias was assessed by calculating the mean difference (%) between the Accu Check device results and results measured with reference method. Measurements did not differ significantly (bias -6.6%, P = 0.146) between Accu Chek and reference method (mean and standard deviation were 10.8 ± 3.5 and 11.6 ± 3.8 mmol/L respectively).
Passing–Bablock regression
Passing-Bablock regression was used to compare the SMBG system with the Olympus AU2700 reference method. The regression equation was: y = 0.1478 + 0.9130x and there was no significant deviation from linearity.
Bland-Altman analysis
The graph displays a scatter diagram of the differences plotted against the averages of two measurements (Figure 1). Horizontal lines were drawn at the mean difference, and the mean difference ± 1.96 times the standard deviation of the differences (6). The mean difference of the two glucose measurements was 0.8 ± 0.5 mmol/L.
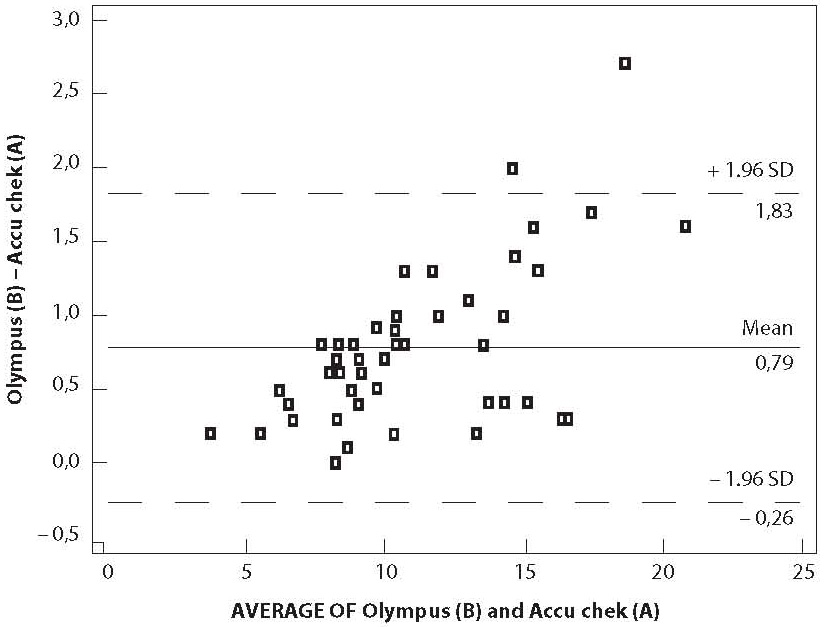
Figure 1. Bland-Altman regression
Error Grid Clarke analysis
In Error Grid Clarke analysis, x-axis is defined as reference method measured blood glucose and the y axis as the value obtained by the glucometer. The error grid is divided into five zones of clinical accuracy; including the appropriateness of the laboratory result. Values in zone A and B are considered to be clinically accurate. Values in zone A do not vary by more that 20% from the laboratory reference value. The difference in zone B is greater than 20% from the reference. While decisions based on zone B results, would not be entirely appropriate, they would not lead to serious consequences for the patient. Values in zone C would result in an overcorrection of blood glucose values, resulting in hyperglycaemia or hypoglycaemia. Zone D represents a dangerous failure to detect and treat errors; the reference values are in hyperglycaemic range, while the blood glucometer displays values that are in normal range. Zone E is defined as “erroneous treatment zone” – glucose values are opposite to the reference values and the treatment decisions would be unsuitable and dangerous (5). The results of the error grid analysis were 100% in zone A of the error grid (Figure 2).
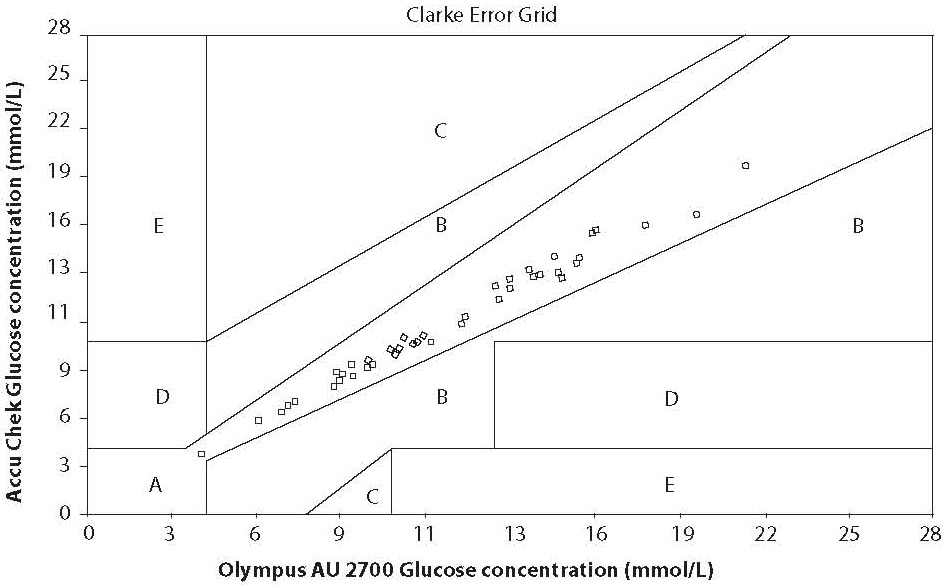
Figure 2. Clarke Error Grid analysis
Precision
Intra-assay precision was determined using ten consecutive measurements of one patient sample and K1 and K2 Accu Chek control samples. Mean, standard deviation and CV were as follows: 6.2 ± 0.1 mmol/L, 1.83%; 4.5 ± 0.1 mmol/L, 2.72%; 11.0 ± 0.2 mmol/L, 1.43% respectively. Precision was within our preset acceptance criteria and therefore regarded as acceptable.
Discussion
Several criteria have been recognized by regulatory agencies as standards for the testing accuracy of glucose monitors. These criteria differ significantly, ranging from high tolerance of up to 20% from the laboratory reference value (National Committee on Clinical Laboratory Standards, NCCLS) to a deviation of only 5% from the reference value (American Diabetes Association, ADA). The most frequently used accuracy criteria is < 10% deviation from the laboratory reference value (International Organization for Standardization, ISO). The average bias of the SMBG system in our study was -6.6%. Our results met the quality specifications of the ISO standards but failed to reach the ADA criterion. 91.7% of our measurements were within the ± 10% of the reference values, as proposed by ISO. Several authors have addressed the issue of accuracy of SMGB systems (7,8,9). The accuracy of SMGB systems reported in those articles, showed 78.3%, 73% and 55% of measurements within ± 10% of the reference values. The “good” SMBG systems were defined if > 60% of the measurements are within the ± 10% of the reference values (7).
The correlation between SMBG and glucose concentration of reference method is often interpreted as a measure of accuracy. Some investigators have reported coefficient of correlation ranging from 0.904 to 0.998 (10,11). Though pointing to the significant association of two methods, our correlation coefficient (R = 0.913, P < 0.05) was relatively low, most probably due to the matrix differences of biological samples (whole blood vs. serum).
Passing-Bablock regression analysis and bias (absolute error) may not be good enough for this assessment. Despite the fact that correlation showed no significant deviation from linearity and the absolute error is within the permitted limits, two measurements can still differ for the constant bias. Therefore it is highly recommended to supplement the initial analysis with some other, more sensitive statistical tests, such as Bland-Altman plot and Error-grid analysis (6,12). Bland-Altman graph displays a scatter diagram of the differences plotted against the averages of two measurements. Since more than 95% of our values are between mean ± 1.96 SD, the differences between these two methods are not statistically important and they may be used interchangeably (6). As shown in the Bland-Altman analysis of our results observed differences between the glucometer and the reference method were larger at higher glucose concentrations. Cohen et al. had same observation (13). The difference may be not only due to the different measurement systems, but also due to the different specimens used.
Last, we assessed accuracy by error grid analysis. As already mentioned previously, the error grid takes into account both the differences between the reference and the SMBG-system values and the relevance of the treatment decision resulting from the SMBG value. The Clarke Error Grid analysis is nowadays accepted as a gold standard statistical method for determining the accuracy of blood glucose meters. Our results of the error grid analysis were 100% in zone A of the error grid and were considered clinically accurate.
The overall variability of our results was low, much lower than the preset acceptance criteria for all three glucose levels measured. Furthermore, precision at two out of three levels have even met the stringent Westgard criteria (less than 2.2%) (14). According to the literature reports, it is well known that SMBG systems rarely fulfil Westgard’s criteria. According to some authors the overall imprecision for SMBG systems ranges from 6–15 % (9,13).
Based on our results we herein conclude that Accu Chek Compact Plus blood glucometer has a good accuracy and satisfactory precision and may be used interchangeably with our laboratory reference system (Olympus AU2700) for daily glucose monitoring.
Acknowledgements
This study was supported by Ministry of Science, Education and Sports, Republic of Croatia, project number 134-1340227-0200. The authors also wish to thank to Roche d.o.o., Croatia, for providing us with Accu Chek Compact Plus blood glucometer, test strips and control material used in this evaluation.