Introduction
Von Willebrand factor (vWF) is a multimeric glycoprotein that plays a major role in the primary hemostatic process. It is synthesized in endothelial cells and megakaryocytes, and secreted as ultra-large vWF (ULvWF). vWF multimers are formed within the endoplasmic reticulum and secreted into the plasma primarily by endothelial cells where additional processing occurs (1). At sites of vascular injury, vWF induces platelet adhesion and aggregation (2). ULvWF are very active and must be processed. This occurs on the surface of endothelial cells by ADAMTS13, a specific metalloproteinase belonging to the ADAMTS (a disintegrin and metalloprotease with trombospondin type 1 repeats) family (3). ADAMTS13 regulates the size of vWF and is therefore crucial for its normal physiological activity. In the case of ADAMTS13 deficiency, vWF forms large multimers in the plasma, which spontaneously bind platelets and induce aggregation (4,5). A deficiency in ADAMTS13 activity has been implicated in the development of thrombotic thrombocytopenic purpura (TTP). The congenital form of TTP is caused by a mutation in the ADAMTS13 gene, while autoantibodies diminish ADAMTS13 activity in the acquired form. The activity of ADAMTS13 in TTP patients is severally deficient, being less than 5% of normal plasma activity (6,7).
Laboratory results are associated with a certain degree of variation, mainly due to analytical and biological variations. In automated and standardized test systems, the analytical variation is often much lower than the biological variation. Biological variation has two main components: within-subject variability, which is the result of the variability in the same subject over time, and between-subject variability, which due to heterogeneous physiology among subjects (8). For accurate interpretation of patient vWF and ADAMTS13 test results, the biological variation associated with these assays must be determined. In the present study, we aimed to investigate the biological variation of ADAMTS13 antigenicity and activity for the first time. We also measured the biological variations of vWF antigenicity and activity which have shown heterogeneity in the results in earlier studies (8-11). Additionally, the reference change value (RCV) and index of individuality (II) for both vWF and ADAMTS13 antigenicity and activity were calculated.
Materials and methods
Subjects
This study was conducted at the Acibadem Labmed Clinical Laboratories in Istanbul, Turkey. The study protocol was approved by the Ethical Committee of Acibadem University. All participants signed informed consent. A total of 19 subjects (10 male, 9 female) with a mean age of 30 years (range 21–40) were recruited to estimate the biological variations of vWF and ADAMTS13 antigenicity and activity. Different number of samples were used for vWF (19 samples) and ADAMTS13 antigenicity (16 samples) and activity (15 samples). The subjects were apparently healthy and did not have a history of bleeding disorders, pregnancy, drug abuse or medical prescription.
Methods
Fasting venous blood samples were collected weekly between 8 and 10 am on the same day for 5 consecutive weeks. All subjects were in a sitting position, and 2 mL of blood samples were collected (in BD Vacutainer tube, containing Na3-citrate as anticoagulant, Plymouth, UK) after 10 min of rest by a single phlebotomist. All blood samples were transported to the laboratory under identical conditions in terms of temperature and elapsed time. All samples were centrifuged at 1500 ´ g for 10 min and the plasma was aliquoted and stored at -80 ºC until analysis. ADAMTS13 antigenicity and activity were determined using ELISA methods as described by the manufacturer (Technoclone GmbH, Vienna, Austria). According to the data given by the manufacturer, the detection limit of the ADAMTS13 antigenicity assay was 0.02 µg/mL, while that of the activity assay was 0.2%. The vWF antigenicity was determined by an immunoturbidimetric method (Diagnostica Stago, Asnieres sur Seine, France). vWF activity was determined using the ristocetin cofactor assay (RICOF) with optical-turbidimetric detection (CHRONO-LOG Lumi Aggregometer, PA, USA). We used the same lot of reagents. According to the data given by the manufacturer, the detection limits of vWF antigenicity and activity were both 1.0%. For internal quality control (QC), we routinely use commercially available QC samples to calculate the analytical variation (CVA) of high and low level of ADAMTS13/vWF antigenicity and activity. The result of internal QC data was within acceptable range. Due to matrix problem, we preferred patients’ samples instead of commercially available QC samples. For each method, we selected a patient plasma sample randomly and measured the tests several times in the same run to calculate within-run CVA.
Statistical analysis
Data were analyzed for the presence of outliers using Grubbers’ test. Modified Levene Test was used for homogeneity of variances. We used nested analysis of variance (nested ANOVA) to calculate the total within- and total between-subject variations using inter-individual values for between-subjects and inter-week values for within-subjects. P-values < 0.05 were considered to indicate statistical significance. The biological component variation for each test was then determined by subtracting the CVA from the total within-subject and total-between subject variations as given below (12):
CVT = (CVB2 + CVA2)1/2
Where CVT is the total coefficient of variation, CVB is the biological coefficient of variation, andCVA is the analytical coefficient of variation.
Biological coefficient of variation can be obtained as:
CVB = (CVT2 - CVA2)1/2
We calculated the index of individuality (II) using the method described by Fraser (7) as follows:
II = (CVA2 + CVI2)1/2 / CVG
where CVW is the within-subject biological coefficient of variation and CVG is the between-subject biological coefficient of variation.
Calculating II is usually simplified to the following equation:
II = CVW / CVG
Finally, we calculated RCV using the method described by Fraser (12) as follows:
RCV = 21/2 x Z x (CVW2 + CVA2)1/2
Where Zis a constant, depending on the probability and most often 1.96 is used as significant, that is, P < 0.05.
Results
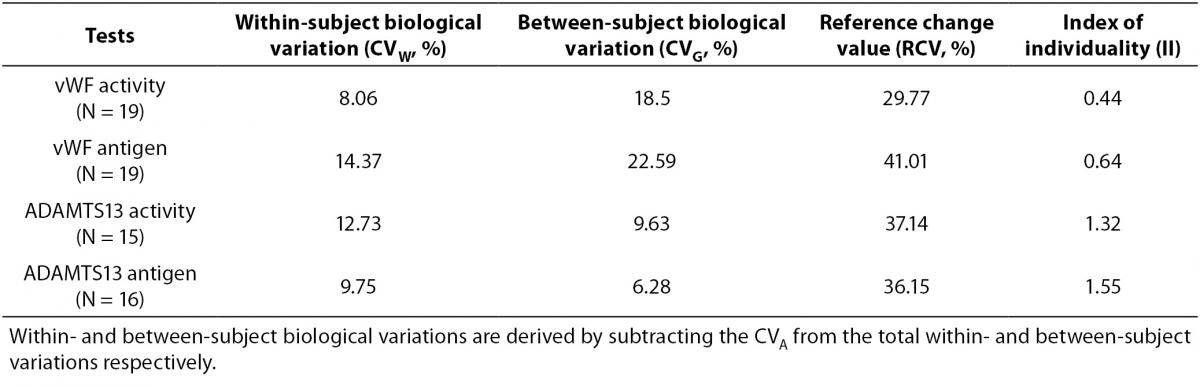
Tables 1 and 2 show the main findings of this study. Table 1 shows the total variation (biological and analytical) for each test. As shown in table 2, the within-subject biological variations of vWF activity and antigenicity were lower than the between-subject biological variations. However, the within-subject biological variations of ADAMTS13 activity and antigenicity were higher than the between-subject biological variations. The II of vWF activity (0.44) and antigenicity (0.64) were lower than that of ADAMTS13 activity (1.32) and antigenicity (1.55).
Table 1. Total variation (biological and analytical) for each test.
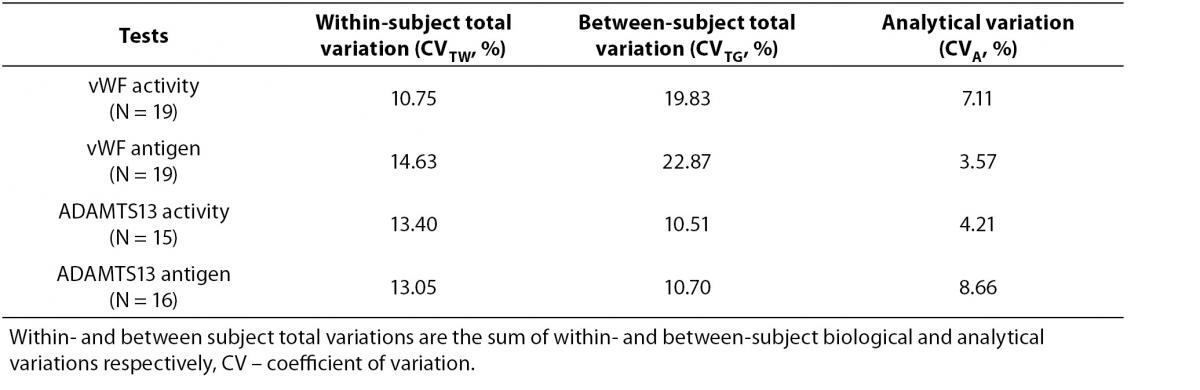
Table 2. Biological variation, RCV and II for each test.
The mean and absolute range of vWF and ADAMTS13 antigenicity and activity are shown in figures 1 and 2, respectively. The range of vWF antigenicity and activity values shows that individual variation accounts for only a small portal of the total dispersion for all subjects (Figure 1). The range of subject values for ADAMTS13 antigenicity and activity was not as varied as that of vWF antigenicity (Figure 2). Statistically, there was an outlier in ADAMTS13 antigen group and we excluded the data of this subject from the study. The dispersion of vWF antigenicity values was similar to vWF activity, while ADAMTS13 antigenicity was also found to be similar to activity. The RCV of vWF antigenicity was higher than the activity RCV (41.01% versus 29.77%) (Table 2). However, the RCV of ADAMTS13 antigenicity and activity were similar at 36.15% and 37.14%, respectively.
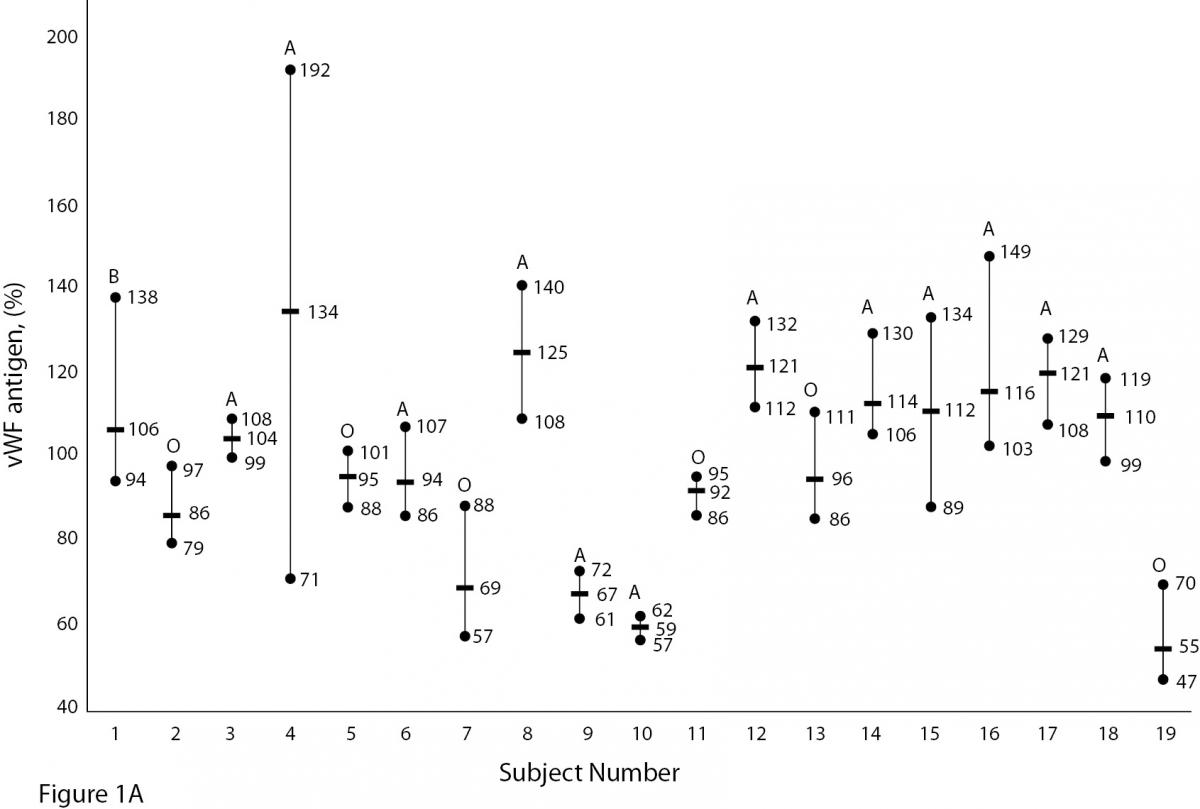
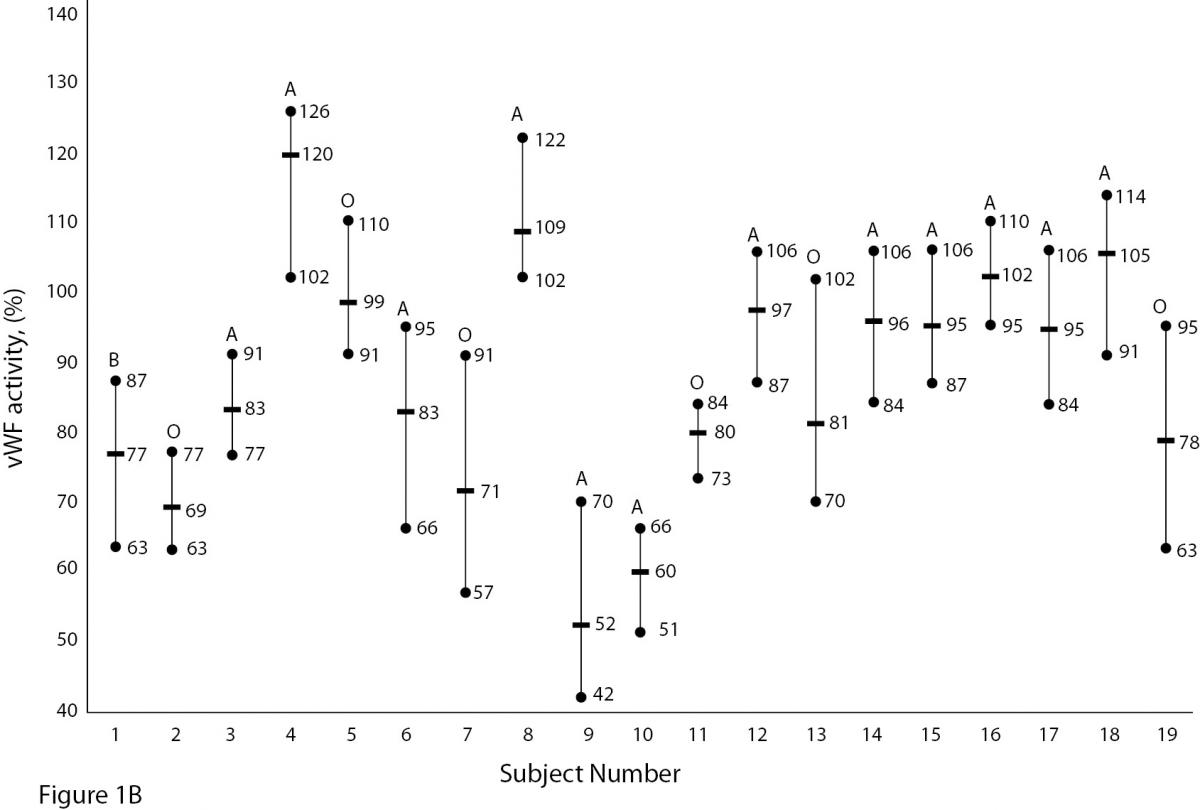
Figure 1A and B. The mean and absolute range of vWF antigen and activity in human adults (1-10: men; 10-19: women). The subjects in Figure A and B have been denoted by the same number on the X-axis.
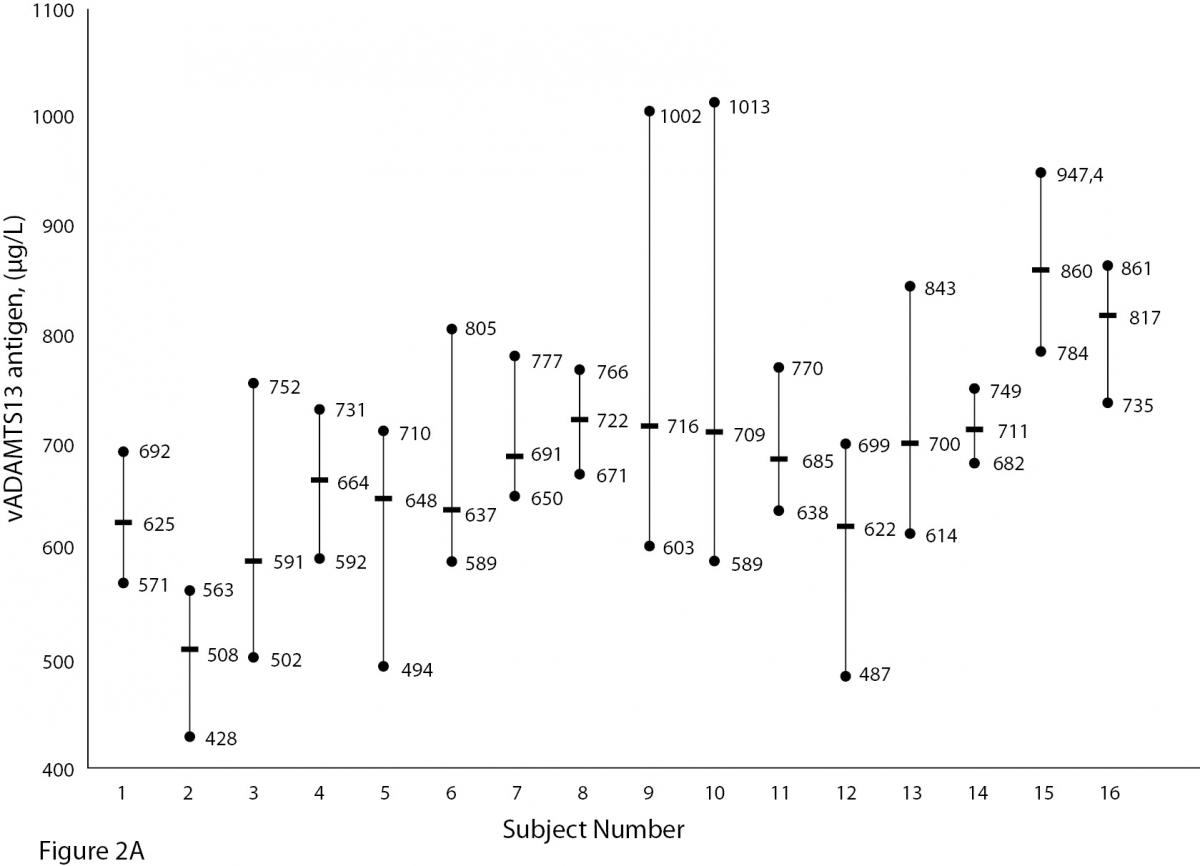
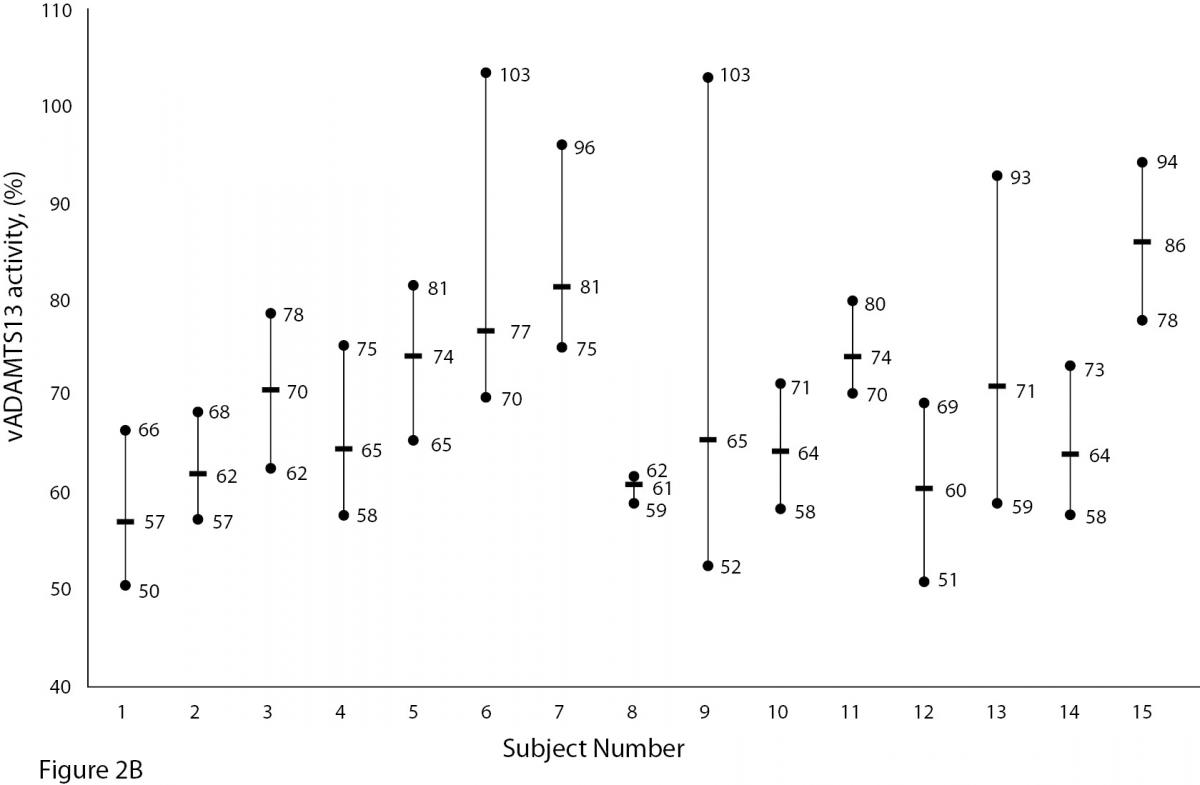
Figure 2A and B. The mean and absolute range of ADAMTS13 antigen (1-8: women; men; 9-16: men) and activity (1-8: men; women; 9-15: men) in human adults. Except number 16 in Figure A, the subjects in Figure A and B have been denoted by the same number on the X-axis.
Discussion
The present study shows for the first time that ADAMTS13 antigenicity and activity have high within- and between-individual biological variation, but low individuality. In the daily practice of clinical testing, biological variation is critical to patient diagnosis and monitoring. Diagnosis requires the use of reference intervals, while condition monitoring relies on the analysis of consecutive test results.
We compare patient test results to the reference interval, a value accepted as normal. The reference interval is obtained from apparently healthy populations served in the region, and is therefore referred to as a population-based reference interval. In general, at least 120 reference subjects are randomly selected from the population, according to the criteria of the IFCC (International Federation of Clinical Chemistry and Laboratory Medicine) and CLSI (Clinical and Laboratory Standards Institute), and test results are used to determine the reference interval (13,14).
A population-based reference interval is not an ideal tool for interpreting patient results, particularly in the case of diagnosis. Due to individuality, the data obtained from some healthy individuals may be outside of the reference interval. To evaluate the effect of individuality, II is determined. As given in the equation 4, the ratio of CVW to between CVG is used for II calculation. II values greater than 1.4 indicate that the analyte has little individuality, while a low II (< 1.0) conveys an analyte with marked individuality (12,15). Comparison of the test result with the population-based reference interval is a satisfactory practice only for analytes with the index of individuality higher than 1, with the highest sensitivity for index values higher than 1.4. An II test value below 1.0, particularly less than 0.6, indicates it is not appropriate to use the population-based references interval, while an II value higher than 1.4 indicates a population-based reference interval can be safely applied (16).
This study found the II value of ADAMTS13 activity to be 1.32 and 1.55 for ADAMTS13 antigenicity. These results indicate ADAMTS13 antigenicity and activity exhibit little individuality. We were not able to find data in the literature related to the biological variation and II of ADAMTS13 while preparing this manuscript, and were therefore unable to compare our data to previous findings.
Unlike ADAMTS, the biological variation of vWF has been studied. Various data for vWF have been reported, depending on the population studied. Indeed, genetic factors have been found to highly influence plasma vWF levels (17). vWF levels also increase with age and may be 25% lower in individuals whose blood group is O (18,19).As shown in Figure 1A and B, visually, vWF levels seems to be lover in individuals whose blood group is O in comparison to other groups. As far as we know, biological variations of vWF, based on subjects’ blood groups, have not been studied.
In the literature, the number of subjects, duration of studies and time interval between consecutive sampling of biological variation studies shows great variability and has not been standardized. In our study we collected samples weekly for 5 consecutive weeks. However, Thompson et al. (10) followed 14 subjects (6 male and 8 female) for 3 years and made 20 measurements. Thompson et al. (10) reported the within- and between-subject biological variations of vWF antigenicity to be 28% and 71%, respectively. The database of biological variation reported the within- and between-subject biological variations of vWF activity to be 2.5% and 27.5%, respectively (20). Similarly, this database documented the within- and between-subject biological variations of vWF antigenicity as 5.0% and 18.0%, respectively (20).
The values obtained from the database were used to calculate the IIs of vWF activity (0.09) and antigenicity (0.28). The II of vWF antigenicity reported by Thompson et al. (10) was 0.39. We determined the II to be 0.44 for activity and 0.64 for antigenicity. Since the II of both vWF antigenicity and activity were low, we speculate that vWF results exhibit marked individuality. This suggests that an individual can have a unique vWF activity value outside the range of other individuals. It means that the worldwide used practice for comparing each test result with the corresponding population-based reference interval is not suitable in case of marked individuality of the analyte. Instead, comparison of the current test result in relation to the previous result is likely to be better approach for interpretation of the test result. Consequently, the population-based reference interval may not be adequate for the interpretation of patient results and the vWF reference intervals should be re-evaluated for subgroups.
In the literature we can find data related to biological variation of many tests and we do not need to evaluate the components of biological variation for all analytes in our laboratory. However the data available in the literature are not homogenous and, as shown in vWF, for the same test we can find different results. To overcome the heterogeneity problem we need to standardize the pre-analytical influences and use correct statistical tests. Recently Røraas T. et al. (21), published an important paper related to the study design of biological variation to obtain reliable data. Pre-analytical variables, particularly those that are controllable, such as posture, exercise, smoking and so on should be standardized prior to biological variation studies. For this purpose we need a guideline to standardize the pre-analytical variables. Additionally, meta-analysis may be required to obtain reliable data of biological variation for clinical practice.
RCV is particularly important for monitoring patients, where it is used to interpret the difference between two consecutive test results. As shown in the equation 5, data on within-subject biological variation and analytical precision can be used to determine the significant change of two serial results while for assessing the utility of population-based reference intervals. If the difference between two consecutive results is less than the RCV, the result is not statistically significant. Therefore, the difference between two consecutive results should not necessarily be interpreted as the result of a therapy. RCV value is crucial in the evaluation of therapeutic effects. For example, a difference between two consecutive ADAMTS13 activity measurements of less than 37.14% (Table 2) means that the difference may be due to random oscillation rather than the result of a significant change. To calculate the RCV, both the analytical and biological variation must be known. Biological variation may be documented in the literature if it has been studied, while analytical variation is unique to the equipment and reagents of the laboratory in question. For this reason, each laboratory should determine the RCV for each test. Here we calculated the RCV of each test using the data in tables 1 (analytical variation) and 2 (within-subject biological variation), as described by Fraser (16).
There are some limitations to this study. Some influences such as age, race, sex, blood groups are important factors in biological variation studies. As shown in Figure 1A and B, vWF levels seem to be lower in individuals whose blood group is O (18, 19). In our study we did not calculate the biological variation for subgroups such as age, sex and different blood groups. The statistic of small group is not reliable and we need large number subjects to determine biological variation of vWF and ADAMTS13 for subgroups. Additionally, the duration of our study is 5 weeks and consecutive measurement within a long period including large number subjects might be needed for more accurate data.
In conclusion, ADAMTS13 antigenicity and activity displayed high between- and within-subject biological variations, but low individuality. Similarly, vWF antigenicity and activity exhibited high between- and within-subject biological variations, but high individuality. Population-based reference intervals may be useful for monitoring ADAMTS13 antigenicity and activity, but not for vWF, which displays high individuality.