Introduction
Strategies in the field of risk management and patient safety are aimed at the prevention, detection and mitigation of adverse events through the analysis of errors. In the clinical laboratory all errors must be measured and controlled, from the obvious ones to those that do not originate in the laboratory (1), by means of indicators providing an objective assessment of the problem and, when appropriate, by carrying out comparisons between different laboratories and different periods of time. According to point 4.12.4 of ISO 15189, “Medical laboratories – particular requirements for quality and competence”, laboratory managers should implement quality indicators for the systematic monitoring and evaluation of the laboratory’s contribution to patient care (2). Moreover, the European Committee of Experts on Management of Safety and Quality in Health Care has proposed that indicators should be useful, identify the critical steps in each process, reflect their potential and make it possible to continuously assess safety in healthcare procedures, in order to accredit sustained improvement and to determine when deficiencies occur (3).
Since the 1960s, with the introduction of analytical quality control, the approach taken to ensuring quality has evolved, focusing in turn on concepts such as quality guarantees, the management of quality, the use of quality goals, the specification of operational processes and of the resources needed to meet the objectives of the system (4) and total quality management, to the more recent focus on clinical safety and risk management (5-8). From this standpoint, Technical Specification ISO/TS 22367, “Medical laboratories. Reduction of error through risk management and continual improvement” was developed to indicate how risk management should be implemented in the structure, organisation, operation and quality management system of the clinical laboratory, with special emphasis on the pre and post-analytical phases (9).
Of the three key processes in the clinical laboratory, the analytical phase is the most highly standardised, with well-defined indicators and internationally-accepted specifications for a large number of biological magnitudes (10-12). All studies agree that it is in the extra-analytical processes where the greatest number of errors occur, especially in the pre-analytical stage. These processes, moreover, are the most critical (13-15) and the hardest to manage, due to the decentralisation of extractions, involving the participation of various professionals (physicians, specialists of laboratory medicine, nurses, laboratory technologists and technicians, phlebotomists etc.), organisations and healthcare centres.
In this study we describe quality indicators of the pre-analytical process, grouping errors according to patient risk as critical or major, and assess their evaluation over a five-year period.
Material and methods
Design
A descriptive study was carried out of the temporal evolution of the pre-analytical quality indicators proposed for monitoring clinical risk, at the Clinical Laboratory of Antequera Hospital.
Data source
The study population was constituted of all the analytical requests received by the laboratory (no exclusion criteria were applied) from primary healthcare providers (approximately 41%), specialists (33%), hospital inpatient departments (6%) and accident and emergency departments (20%), during the period 2007-2011, inclusive.
The Clinical Laboratory of Antequera Hospital is a Clinical Management Unit, certified in accordance with ISO 9001:2008, and by the Andalusian Agency for Healthcare Quality, Advanced level. It provides the specialised services of clinical biochemistry (4 physicians), microbiology (1 physician) and haematology (3 physicians), assisted by 21 technical and 3 administrative staff, using a laboratory information system (LIS) with no electronic request facility (Open for Labs ®). It is organised into working units according to the technology involved, with a central laboratory that carries out both scheduled and urgent tasks. This laboratory is equipped with 2 haematology cell counters, 2 automated haemostasis analysers, 2 biochemistry analysers and 2 analysers for immunochemical techniques, with no pre-analytical automation. In addition, the biochemical area has an automated urinalysis system, two blood gas analysers and an osmometer. A special technical unit performs the analyses for studies of allergies and autoimmune diseases, using an automated system for autoimmunity and allergy, and seminal fluids.
The laboratory attends a population of 115,155 inhabitants (2010 census), divided among four Basic Health Areas with 19 Clinics and Neighbourhood Clinical Sampling Centres. In 2011, it received 155,999 requests for analysis, giving rise to 1,628,852 individual results. All clinical samples, both in hospitals and in primary healthcare, are taken by external nursing staff, unrelated to the laboratory, and all specimens are centrifuged at the primary healthcare centre before their transfer to the laboratory. The centrifugation process is supervised by the nursing department at the centre.
The indicators were designed in 2006 following a descriptive Modal Failure and Effects Analysis (MFEA), carried out as an integral part of the pre-analytical phase, a process in which the Neighbourhood Clinical Sampling Centres were included. This analysis made it possible to define the critical steps in clinical sampling processes that can lead to mistakes being made, thus enabling circuits to be redesigned and procedures restructured. In this analysis, mistakes are classified in accordance with the corresponding Risk Priority Number (RPN), which enables us to prioritise those to be monitored. This number is obtained by multiplying the scores given to evaluate the frequency of occurrence of the error and its severity (on a scale of 1 to 10, from least to most frequent/severe) and the probability of error detection (on an inverse scale, from 10: low probability to 1: high probability).
Three main categories of mistake were identified: “critical” mistakes (RPN > 500), arising mainly from the type of analytical request and the means used to communicate and record it, with severe consequences for the patient if not rapidly detected and corrected (16); “major” ones, arising from inadequate application of the sampling procedure (RPN: 112-315); and “minor” ones, considered as such due to the low likelihood of their occurrence, high probability of detection or absence of severity (RPN < 100). These latter mistakes were only taken into account for the purposes of reviewing procedures and technical instructions (17). This analytical tool has its limitations, especially in the healthcare context, because it is designed for industrial use before a product is marketed; in any case, any critical error should be seen as such regardless of the NPR value determined. The project was approved by the laboratory’s senior management.
To ensure ongoing improvement, it is of fundamental importance to provide training in safety procedures. For this reason, accredited courses were given to laboratory staff in 2008, 2009 and 2010. In the latter year, the course was oriented toward transfusion safety, while practical sessions for nursing staff in specimen-taking procedures were organised in 2009. It is essential for staff to actively learn from mistakes, and so the indicator results are reported to the services involved every three months. An annual retrospective analysis is made of the results, and this is published in the corresponding management report.
Outcome variables: indicators
- Critical error in patient identification, when administrative staff manually enters the analytical request into the LIS.
- Critical errors that could compromise patient safety, recorded by a notice of non-conformity. Such errors might originate outside the laboratory (a request in which the patient is incorrectly identified and/or the sample presents such a misidentification) or within it, due to an identification error in producing the aliquot.
- Total rate of critical errors.
- Haemolysed sample: for both serum and plasma samples, any degree of haemolysis from ‘slightly haemolysed’ to ‘highly haemolysed’, is logged as ‘haemolysed sample’, by direct observation and checking against a colorimetric table published by the Spanish Society for Clinical Chemistry, which expresses the equivalent of a haemoglobin concentration ranging from 0 (absence of haemolysis) to 10 g/L.
- Clotted sample: in blood with ethylenediaminetetraacetic acid (EDTA) or with sodium citrate, by direct observation in the presence of coagulation.
- Inadequate sample container (refers to any type of sample).
- Insufficient sample (refers to any type of sample).
- Blood sample not submitted.
- Urine sample not submitted.
- Total rate of major errors.
Data collection
To compile data on critical errors, a database was designed to record the errors occurring in the laboratory, when analytical requests are manually entered into the LIS. Such errors are expected to cease when an electronic request system is implemented. These errors are currently detected either when the healthcare clinic requests an analytical report that cannot be found, or when primary healthcare centres check the analytical reports received against the lists of patients who provided clinical samples. A second data recording system used, for any type of critical error detected in the laboratory (in the present context, pre-analytical and other than those mentioned above), is initiated by means of a notice of “non-conformity” (18). Such errors may be detected by the analyst on checking the report, or also by the physician, on observing that the details do not correspond to the clinical data, and are communicated to the laboratory. In either case, a procedure has been implemented to declare and record such events, via the quality manager or the laboratory management system.
All errors related to the absence of sample quality are entered into the LIS directly by the laboratory staff, on receipt of the sample, and are appropriately described by reference to a thesaurus previously created for this purpose. During the study period, the data-compilation methodology remained unchanged.
Statistical analysis
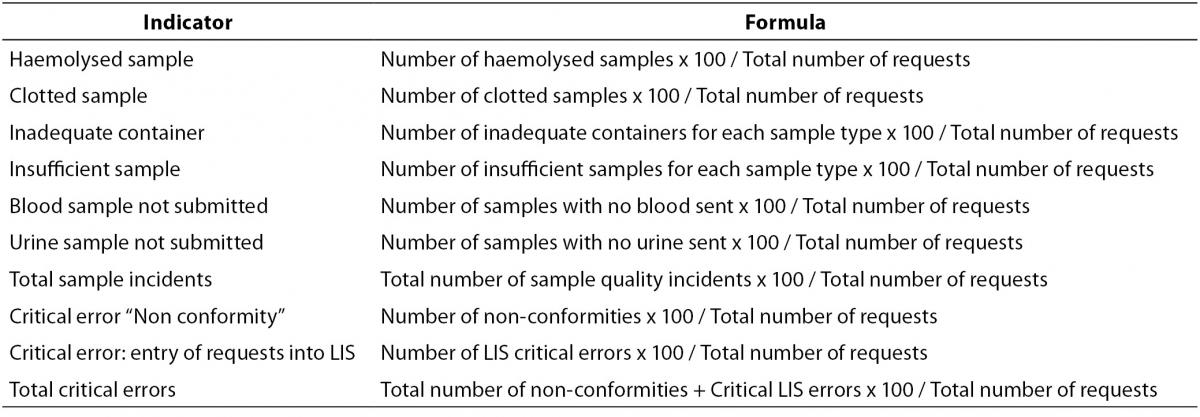
Quarterly rates were calculated for the proposed indicators, with their respective mean values, compared to the total volume of activity, in terms of analytical requests. The formulas used for the calculations are summarised in Table 1. The Runs Test was applied to assess changes in the trend of the series, assuming statistical significance at P < 0.050. To determine the annual volume of requests and statistically significant indicators according to the Runs Test, the base 100 index was calculated with respect to the first year (or quarter) valued, and these indicators were represented by frequency polygons. To estimate the degree of control over the processes, the results were transformed according to the Six Sigma scale, using the Westgard calculator (19), thus obtaining the frequency with which an error is likely to occur. According to the table of equivalence between the Sigma level and defects per million, an error rate of 6.68% corresponds to a Sigma value 3, equivalent to borderline unacceptable, while an error rate of 0.62% corresponds to a Sigma value 4, which reflects a good level of control (19,20).
Table 1. Formulas for calculation of pre-analytical indicators.
Results
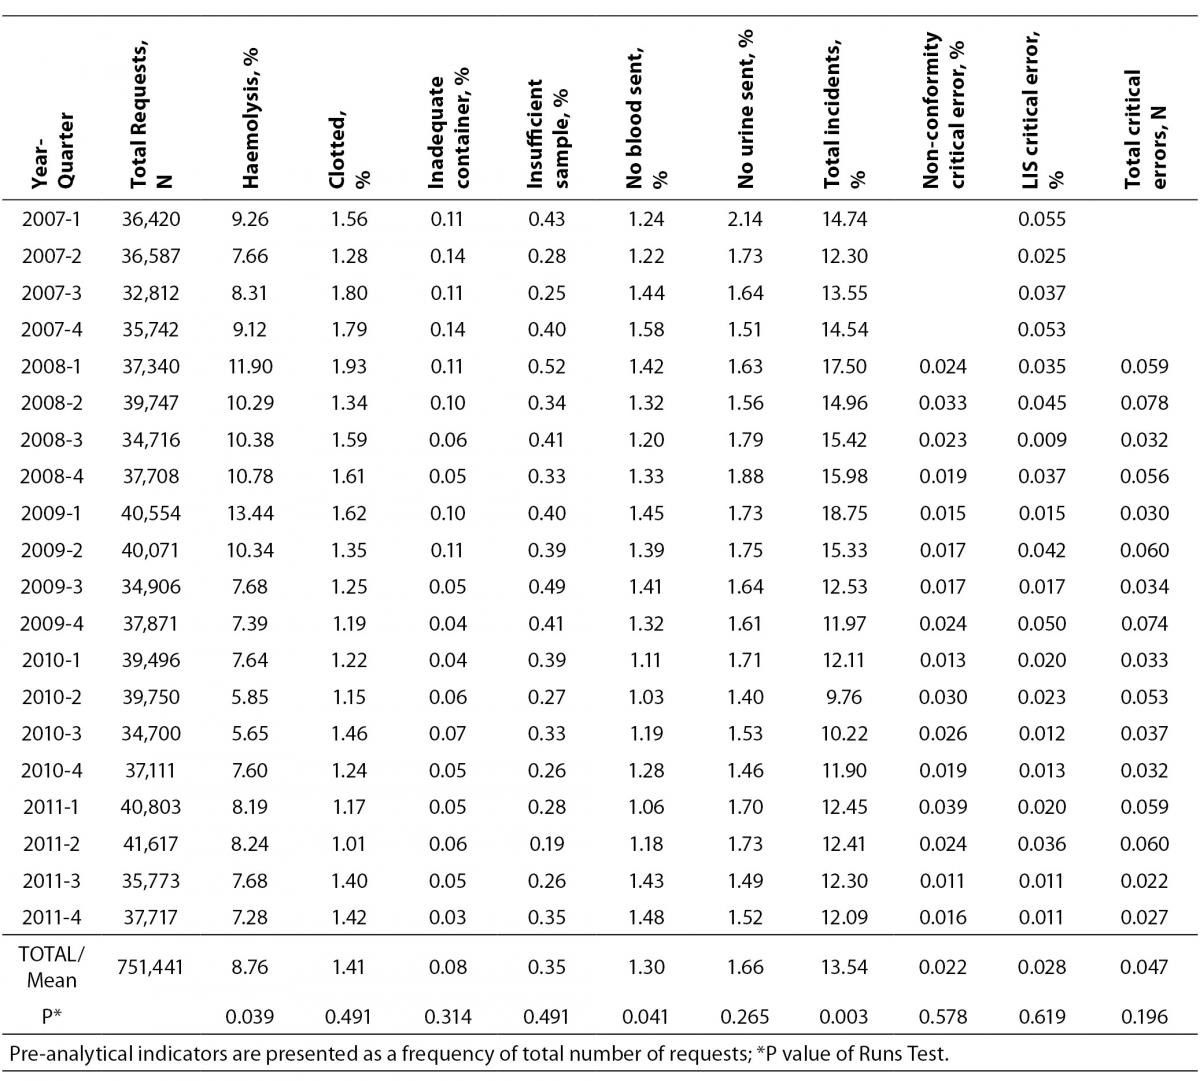
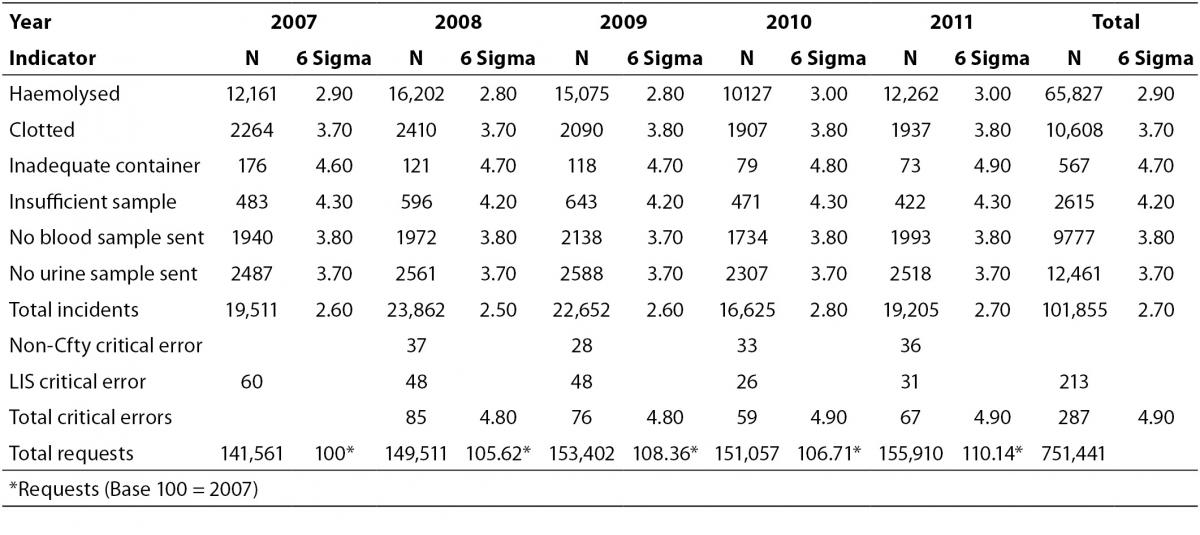
A total of 751,441 analytical requests were made to the Laboratory Service between 2007 and 2011. For the study period, comprehensive information was obtained on all the proposed quality indicators, except for one critical error which was recorded as a non-conformity notice, and not quantified in 2007. In 2007, there were 141,561 requests, and the volume increased by over 10% each year after this. The rates obtained for each indicator, the total sampling errors for the study period and the P-value for the Runs Test are summarised in Table 2. Table 3 shows the Six Sigma values and the average for each indicator.
Table 2. Quarterly rates of pre-analytical indicators.
Table 3. Average Six Sigma values for indicator
Pre-analytical critical error indicator
The total rate of pre-analytical critical errors was 0.047%, obtained from the average non-conformity critical error of 0.022% (since 2008), and the value of 0.028% of errors in data entered into the LIS. The Runs Test reflected no changes in the trend for either type of error. According to the Westgard calculator this error rate corresponds to a Sigma Six value of 4.9.
Of the 134 non-conformity errors reported, 50.74% of the samples did not correspond to the patient described in the analytical request, while 44.03% of the samples corresponded to an error made by the physician in formulating the analytical request. All of these errors remained undetected by the nursing staff, who failed to confirm the identity of the patient before performing the extraction. In one case, a sample required for judicial proceedings was invalidated by incorrect collection, and on three occasions results were found to be contaminated (one with EDTA and the other two with glucosaline solution from the sampling apparatus). The remaining three cases originated in the laboratory: twice, samples from different paediatric patients were combined in order to obtain a greater sample volume, and once, an error arose in the manual preparation of the sample aliquot.
Indicators related to specimen-collection errors
The total error rate for the study period was 13.54%, with a P-value for the Runs Test of 0.003. The lowest rate per 100 requests was for the indicator “inadequate container” (0.08%) followed by “insufficient sample” (0.35%), while the highest rates corresponded to the indicators “haemolysed sample” (8.76%), “urine sample not submitted” (1.66%) and “clotted sample” (1.41%).
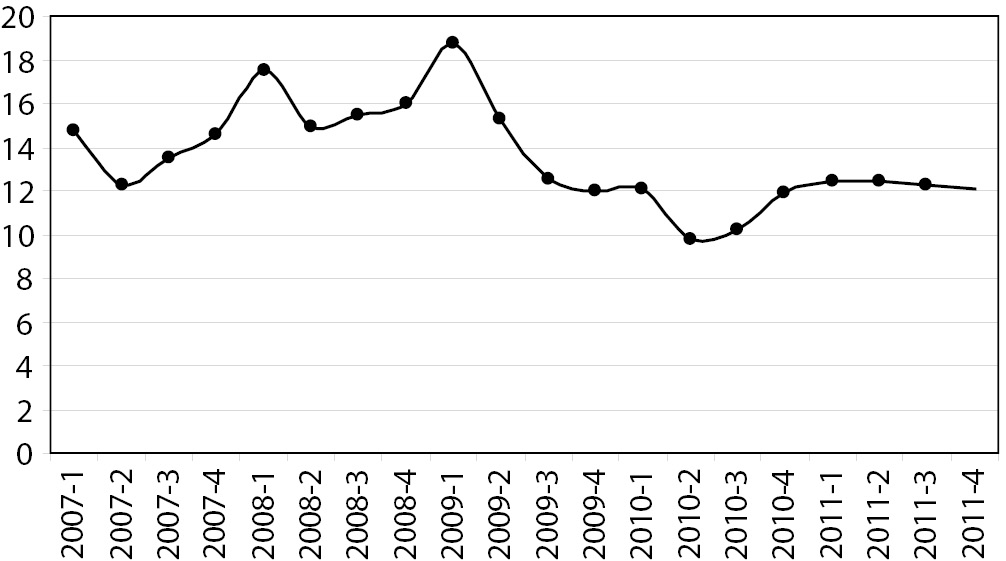
Statistically significant differences were identified by the Runs Test, in addition to the total rate of incidents, for the indicators “haemolysed sample” and “blood sample not submitted”, both at P = 0.039, and the total rate of errors decreased appreciably from the second quarter of 2009 (Figure 1).
Figure 1. Quarterly total rate of major errors (rate per 100 requests).
Translated into Sigma metrics, the error rate was 2.7%, fundamentally regarding the indicator “haemolysed sample”, with a Sigma Six value of 2.9. For the remaining processes, the Sigma values ranged from 3.7 (“clotted sample”) to 4.7 (‘inadequate container”).
Discussion
A precise calculation was made of the magnitude of the pre-analytical errors associated with our activity and area of organisation, after implementing a FMEA, during the period 2007-11. This analysis considered, first, critical errors, i.e., those which could lead to the analytical report being assigned to another patient or to erroneous results being reported, thereby provoking a misdiagnosis or incorrect treatment decisions being established, as a result of the procedure and the means by which analytical requests are made and entered into the system. A second group of errors, arising from malpractice in the specimen collection procedure, and considered “major” insofar as they affect analytical quality, cause delays, require additional or repeated analyses and increase costs.
The issue of pre-analytical quality indicators is not a novel one, but this study proposes an innovative approach to developing such indicators and defining their scope, in accordance with the recommendations of the European Committee of Experts on Management of Safety and Quality in Health Care (3), the requirements of ISO 15189 (2), and the methodology proposed in the Technical Specification ISO 22367:2008. (9) To the best of our knowledge, no previous study has been made to monitor pre-analytical errors after the implementation of a FMEA. Perhaps the main contribution of the present study is its scope: the fact that it has incorporated all the processes involved, in the hospital and in primary health care, taking into account the multidisciplinary professionals involved in the process of obtaining analytical samples, and addressing all areas relevant to the clinical laboratory. Moreover, the study design is highly effective. We propose a prior descriptive analysis that achieves high sensitivity and controls the efficiency of the process, in contrast to a record of predefined or fortuitous errors that presents low sensitivity; this latter approach only ensures good results with respect to individual activities, and provides little or no overall control of the process (21).
Indeed, measuring and managing pre-analytical critical errors continues to be the major challenge facing clinical laboratories (7,8,22,23), and the main difficulty in this respect lies in achieving an effective, systematic design to ensure that safe procedures and processes are adopted, accompanied by all necessary corrective procedures (3,24). Many factors affect patient safety and many variables affect each of the sub-processes, services and healthcare professionals involved in the pre-analytical process. This complexity makes it difficult to manage pre-analytical critical error, and is one reason why the scientific literature in this respect provides very limited data, being focused more on estimating the frequency and specifications of errors related to sample quality than on examining those which are potentially critical. In general, insufficient attention is paid to such errors, as regards their impact on health care (13-15,23). Analysis of our results revealed relatively few “critical errors” compared with previously published data, and these corresponded to the terms “error in patient identification in inputting data to the LIS”, “patient name incorrect on the request” or “no specimen/analytical request traceability” (13,14,25-29), although these studies are methodologically different. It is unrealistic to believe that all critical errors are recorded, but all healthcare centres check their lists against analytical requests and we analysed all analytical incidents in search of possible errors. Furthermore, the act of recording them, as proposed in Technical Specification ISO/TS 22367, through the creation of a “non-conformity” notice (9), means they can be investigated on an individual basis, to analyse the cause and the potential harm to the patient, and to take preventive and corrective measures.
It is essential to learn from mistakes, and for this reason a quarterly report of the results of the indicators is communicated to senior management, to the medical officers, to the hospital’s quality controllers, to the heads of unit (in hospitals and primary care) and to nursing managers. These activities, together with the laboratory’s policy of always rejecting doubtful samples, and in such cases demanding a new sample request and specimen collection, has led to the establishment of a culture oriented toward safety and the recognition of errors committed. It is beyond the scope of this study to investigate possible harm caused to the patient.
After application of FMEA to obtain suitable indicators, the Sigma methodology was used as a statistical tool to quantify the results, expressed as defects per million opportunities (30,31), to evaluate the effectiveness of the training and information actions aimed at improving the system and to compare them with the standards proposed by Llopis et al. (27) and with the preliminary data on quality indicators obtained by the IFCC Working Group Project “Laboratory Errors and Patient Safety” (32).
For critical errors, we obtained a Sigma value of 4.9, which indicates that the processes involved are well controlled. However, as suggested by Llopis et al. (27), given the potential danger to the patient of such incidents, their specification should be 0%, equivalent to a Sigma value of 6. In this respect, there were differences in the type of indicators used. In contrast to those proposed in the above-mentioned studies, which focus more on quality or compliance with minimum requirements for analytical requests, in the present study, which is aimed at measuring the risk of critical error in our pre-analytical process, the indicators used are the result of an initial determination of what steps in the processes are to be measured, how and when. These questions are then prioritised according to the level of risk.
In monitoring specimen collection, it is logical to use the percentage of total error for which a bad result is obtained, mainly caused by the indicator “haemolysed sample”. This means that the process is borderline unacceptable and requires a thorough review.
In this study, the criteria for deciding which indicators should be monitored are determined by the MFEA, specifically, by the NPR values obtained, regardless of any preanalytical incident that may be recorded in the analytical report. Comparison with the results of Llopis et al. (27) shows that it is in haemolysis where we are still far from reaching the specifications stipulated. In (27), the largest group of laboratories used the same method of visual inspection, and it is not stated what minimum degree of haemolysis is recorded. A limiting factor of our study, as regards comparison with previous research, is the fact that our results are expressed as a percentage of analytical requests, whether serum or coagulation tube in the absence of a system enabling us to count the number of tubes, and that only a single analytical request form was available for all areas of knowledge.
Moreover, in the case of haemolysis, due to the absence of recommendations as to the minimum degree of haemolysis that should be recorded, our study used a single heading “haemolysed sample”. Nevertheless, the analytical report specified any degree of haemolysis detected, regardless of whether it interfered to a greater or lesser extent with the analysis of the analyte and whether or not the test was invalidated in strongly haemolysed samples. This may compensate, to some degree, for the bias arising from the subjective determination performed, based on visual inspection, and not on the determination of an index of haemolysis using the automated clinical chemistry system. This is a limitation of our study. However, the latest recommendations for improving the assessment of this indicator specify how haemolysis should be identified and quantified and what threshold should be used for rejecting the sample, expressing the indicator in terms of the total number of samples (32). In our study, this indicator produces overvalued results, fundamentally because it counts all stages of haemolysis, and in consequence 25% of the comments made lead to the test being invalidated. The main cause of the high rate of in vitro haemolysis in our context is multifactorial: a) in general, serum rather than plasma is employed; b) the vacuum system is not widely used, the specimen tubes being filled directly using a syringe (33); c) staff are insufficiently skilled in the sampling process.
Our review of the literature revealed different ways by which this type of indicator could be formulated, but these proposals are not comparable with our results, because in some cases they refer to the total number of tests performed (13,15,23), and this type of indicator will always achieve better results when larger magnitudes are involved and when analytical correctness is less well managed. In other cases, which are more recent and more accurate, they are not comparable because they refer to the total number of samples obtained (28,29,32). All the studies reviewed agree that the problems associated with obtaining specimens are the leading cause of pre-analytical errors, with haemolysis presenting greatest variability and comprising the most frequent cause of sample rejection (13,23,27,34,35). Plebani et al. highlighted the urgent need to harmonise quality indicators, in view of how they can be affected by different interpretations and how they are measured by each laboratory. These indicators are subject to three main requirements: they must be patient-centred, consistent with the requirements of the International Standard for medical laboratories accreditation, and address all stages of the total testing process. (36).
In future studies we will consolidate this approach and analyse the changes presented by the indicators after the implementation of definitive forms of improvement and after investigating the possible harm to the patient and the inefficiency costs generated by such errors.
Conclusions
This paper presents a rigorous, patient-centred analysis of the magnitude of pre-analytical errors, in accordance with the requirements of the International Standard for medical laboratories accreditation, incorporating all the sub-processes and personnel involved in the pre-analytical process. The processes that trigger “critical” errors, while not achieving the zero-error level, are well controlled, and errors in the sample-taking process are of only marginal importance, mainly concerning the indicator “haemolysed sample”.