Introduction
Method selection and evaluation are important steps in organizing high quality medical laboratory. Prior to its application, a new method should undergo evaluation in clinical setting, regardless of whether manual or automated measurements, in-house reagents, or a commercial product are in question.
The application of a new method in the laboratory requires previous measurement of analytical imprecision and inaccuracy followed by determination of the method linearity and effect of interfering substances. Laboratory analysis results are primarily influenced by random or systemic errors, which together make the measurement error. Therefore, an analysis result represents the real value decreased, or increased, for the value of the measurement error (1).
Biochemical markers of bone turnover
Biochemical markers of bone turnover have for more than three decades been important clinical indicators in the diagnosis of bone diseases (Paget‘s disease, rickets, osteomalacia, primary and secondary hyperparathyroidism, renal osteodystrophy, osteoporosis). They, however, still do not provide clinicians with sufficiently sensitive and specific data on which they could entirely rely in the diagnosis and therapy, and which could replace invasive and expensive biopsy technique for histomorphometric analysis of pelvic bones (2,3).
The markers of bone turnover are molecules that occur in blood and urine, and reflect the dynamics of bone metabolism. Bone turnover is assessed by measuring serum activities of the enzymes directly involved in bone metabolism, or by measuring the content of collagen fragments and noncollagen proteins of bone matrix in serum and urine (4,5). Numerous markers have been classified into two main groups: markers for evaluation of bone formation (osteocalcin, bone alkaline phosphatase, N- and C-terminal procollagen propeptides), and those for evaluation of bone degradation (tartarate-resistant acid phosphatase, pyridinoline, deoxypyridinoline, hydroxyproline, calcium, N- and C-terminal telopeptides of type I collagen). Each of the markers requires careful evaluation in a specific clinical condition, as their urine and blood concentrations also depend on numerous factors not related to bone metabolism. The application of non-invasive measurement of bone mineral density (BMD) as a „gold standard“ has ensured acceptable precision and accuracy since its introduction and has been accepted among clinicians, yet therapeutic effects based on this method may be observed not earlier than at one/two years due to slow bone metabolism. Therefore, biochemical markers demonstrated their clinical value in the possibility of more rapid assessment of therapeutic success in comparison with densitometry (3,6,7).
During the past fifteen years, the scientific endeavors directed towards the search for better understanding of the basic bone biochemistry and physiology, and thereby also of metabolic bone diseases, led to the discovery of a series of sensitive and specific markers of bone turnover. Nevertheless, the precision and accuracy of the manual methods employed for the measurement of these markers turned out to be of unsatisfactory quality. Inter-laboratory coefficients of variation reaching as high as 71% and inter-individual variability of up to 27% were a considerable analytical issue. Therefore, many automated methods have currently been developed and become available, and their application is a prerequisite for further investigations (3,8,9,10,11).
Total P1NP
Total N-terminal propeptide of type I procollagen is a test recently developed for Elecsys immunochemistry analyzer (Roche Diagnostics, Germany). As a marker of intact bone formation, this test demonstrated numerous clinical advantages (12,13), mainly related to its application in uremic patients since P1NP clearance is mediated by receptors in hepatic endothelial cells and is completely independent of renal dysfunction (14).
Figure 1 shows a molecule of type I procollagen (a form of precursor collagen) which, after specific endopeptidases have detached peptides from the N- and C-terminal end, produces type I collagen, a basic protein that forms approximately 90% of bone matrix. Free propeptides circulate in blood and demonstrate collagen synthesis.
The aim of this study was analytical validation, of P1NP assay.
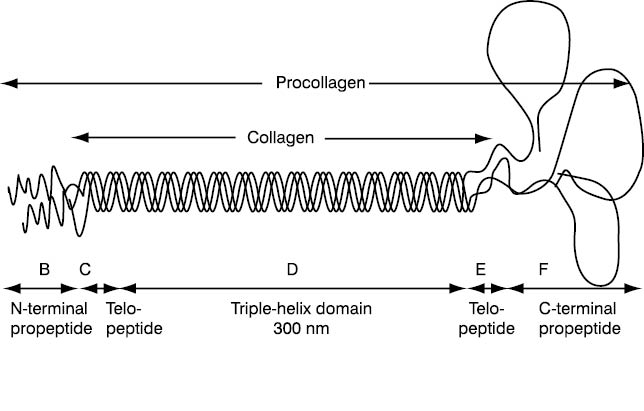
Figure 1. Graphic presentation of type I procollagen with domains representing biochemical markers. P1NP domain is specifically designated (according to Prockop DJ, Kivinkko KI, Tuderman L, Guzman NA. The biosynthesis of collagen and its disorders. N Engl J Med 1979;301:12-23, 77-85). B - Amino-terminal propeptide of type I procollagen propeptide – P1NP; C - Amino-terminal cross-linking telopeptide of type I collagen – INTP; D - triple helix; E - Carboxy-terminal cross-linking telopeptide of type I collagen – ICTP; F - Carboxy-terminal propeptide of type I procollagen– PICP; C + D + E – Collagen
Materials and methods
Reagents
Total P1NP concentration was measured using an original test reagent Total P1NP (03141071, Roche Diagnostics, Mannheim, Germany) on an Elecsys analytical system manufactured by the same company, with two-point calibration also performed using an original calibrator set (Total P1NP CalSet 03141080190; Roche Diagnostics, Mannheim, Germany). This method has been standardized against reference standards precisely defined by weighing native P1NP into an analyte-free human serum matrix (23). The reagents were kept at a temperature of 2-8 °C.
Subjects' samples with P1NP concentrations above the upper detection limit that were used to determine the method linearity were diluted using an original diluent (Elecsys Diluent Universal, 03183971122) containing protein matrix and preservatives.
To examine interference, the following interfering substances were prepared as solutions and added to serum samples: 20% Fresenius Kabi IntralipidTM (Fresenius Kabi, AB, Uppsala, Sweden), bilirubin powder (Kemika, Zagreb, Croatia), and hemoglobin preparation from 5 mL hemolysate of randomly collected blood with EDTA.
Samples
Analyses of imprecision and inaccuracy of the method were performed using PreciControl Bone control samples (163883, Roche Diagnostics, Mannheim, Germany) at three concentration levels: low PC1 (73.5±5.87 µg/L), medium PC2 (508.0±35.7 µg/L) and high PC3 (978.0±68.3 µg/L), and on residual samples of human sera. To determine the method linearity and interference human sera were used. Blood samples were collected during 15 days between 7 and 10 a.m. into Vacutainer test-tubes (Becton Dickinson) without anticoagulant. The sera were separated following centrifugation (10 min at 3,500 rpm), two serum pools (pool I and pool II) were prepared to test imprecision and three serum pools to examine interference. Serum samples with high P1NP concentrations, selected among patients with chronic renal insufficiency on continuous dialysis, were used to prepare another two serum pools (pool III and pool IV) that were used to investigate the method linearity.
Total P1NP concentration measurement
P1NP concentration was measured by electrochemiluminescence (ECLIA) sandwich immunoassay with two monoclonal antibodies. A serum, control sample or calibrator (20 µL) was incubated with P1NP-specific biotin-labeled monoclonal antibodies. After the addition of streptavidin-labeled microparticles and a monoclonal P1NP-specific antibody labeled with ruthenium complex (Tris(2,2̀-bipyridil)ruthenium(II)-complex (Ru(byp)32+)), a sandwich complex was formed and bound to the solid phase (microparticles) due to the biotin and streptavidin interaction. The reaction mixture was then aspirated into the measuring cell where microparticles bound to the electrode surface, while unbound particles were rinsed using ProCell solution. The voltage applied to the electrode caused electron transfer and chemiluminescent emission of the ruthenium complex whose signal was determined luminometrically. All the above procedures and testing of calibration validity were performed automatically on the Elecsys 2010 system; the analysis took 18 minutes.
Calibration
Each reagent set for total P1NP determination has a bar-code label with information on calibration of the particular reagent lot, and information on the master calibration curve prepared by Roche by calibration of the entire analytical range using 10 calibrators. Two-point calibration, or more accurately the compliance with the master calibration curve, was performed with the provided series of low and high calibrators.
Analytical evaluation
Analytical evaluation was performed according to the European Committee on Clinical Laboratory Standards (ECCLS) recommendations (15).
Analysis of imprecision
Within-run imprecision was established by 30 subsequent measurements of two serum pools with medium and high P1NP concentrations, and expressed as coefficient of variation, CV (%). Between-run imprecision was determined by measuring the concentration of control sera PC1, PC2 and PC3 in triplicate over 10 days. The mean of daily measurements was used to calculate imprecision, and results were expressed as CV (%).
Analysis of inaccuracy
Inaccuracy of measurements was evaluated by measuring the values of analytes in control samples during 10 days. It is expressed as a percentage of bias R (%) of the determined mean value (x) from the declared mean value (S). As a measure of inaccuracy we used the percentage R(%) which is expressed as a bias from the declared value. It is calculated in relation to the mean measured value x according to the mathematical formula: (x-S)/S ´ 100%.
Analysis of linearity
The linearity of the method was examined by measuring P1NP concentration in a series of dilutions of two serum pools with P1NP concentrations near and above the upper linearity limit as declared by the manufacturer. In serum pool I, linearity was analyzed through a series of seven dilutions (up to 1:200), and in serum pool II through a series of 5 dilutions (maximum 1:150). The manufacturer declared a linearity range of 5-1,200 µg/L.
Analysis of interference
Analysis of interferences included hyperbilirubinemia, lipemia and hemolysis. Different quantities of interfering substances were added to serum pools but not exceeding the concentration of 1,948.80 μmol/L for bilirubin, 2.32 mmol/L for hemoglobin, and 20.0 mmol/L for triacylglycerol. Then P1NP concentrations were determined in duplicate. The preparation of solutions and dilution sequence was conducted according to the precise protocol by Haeckel (16).
Statistical analysis
Statistical calculation was performed using Excel application (Microsoft Office for Windows XP Professional) according to statistical principles by Westgard et al. for descriptive statistics and linear regression (17-19). The statistical values used for test evaluation were as follows: mean (x), standard deviation (SD), coefficient of variation (CV), percentage of bias (R), coefficient of correlation (r), and linear regression parameters (a and b) for value relations according to the linear regression method.
Results
Imprecision
Resultes are presented in Table 1. and 2. Coefficients of variation (CV) obtained in batch mode of 30 sample runs for two serum pools, pool I and pool II (P1NP concentrations 46.7±1.00 µg/L and 642.6±14.82 µg/L) were 2.14% and 2.31%, respectively. Between-run imprecision was determined on control samples PC1, PC2, and PC3 (P1NP concentrations 66.6±0.95 µg/L, 474.3±8.12 µg/L and 893.3±18.27 µg/L, respectively) and expressed as CV (1.44%, 1.71% and 2.04%, respectively).
Table 1. Within-run imprecision (n=30). Pool I – normal P1NP concentrations (μg/L); pool II – high P1NP concentrations (μg/L)

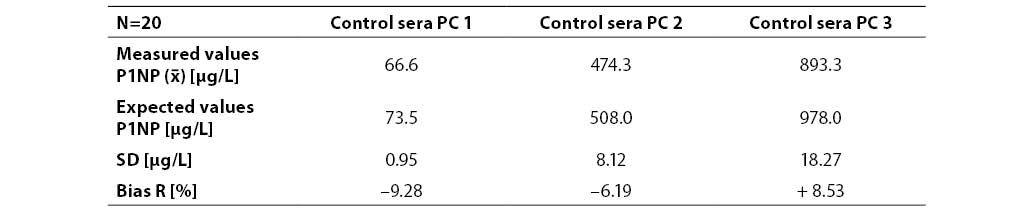
Table 2. Between-run imprecision (n=20). Control sera at three concentration levels (PC1, PC2, PC3)

Inaccuracy
Results are presented in Table 3. The bias R from P1NP declared values in control sera was expressed in percentage. It was 9.28%, 6.19% and 8.53% for PC1, PC2 and PC3, respectively.
Table 3. Inaccuracy of P1NP determination at three concentration levels (n=20; PC1, PC2, PC3 – commercial control sera with low, medium and high concentration level, respectively)
Linearity
Linearity was examined using dilution test on two serum pools for two concentration levels: medium value of the measuring range (544.8 mg/L) and values above the measuring range (>1200 µg/L). The lowest per cent of deviation from the expected result (7.2% and 2.4%) was recorded at 1:2 dilution. Dilution test results are presented in Table 4 and Figures 2 and 3.
Table 4. Dilution test results at two concentration levels to assess P1NP assay linearity
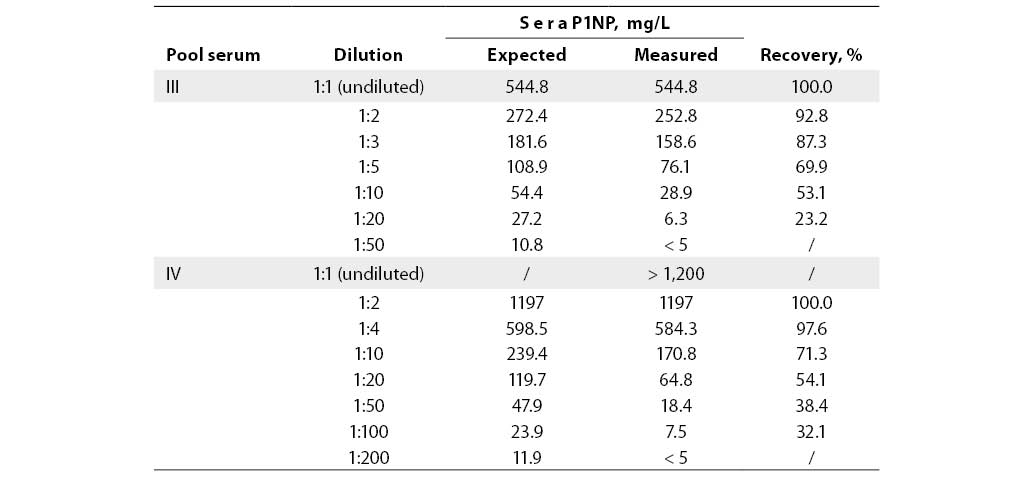
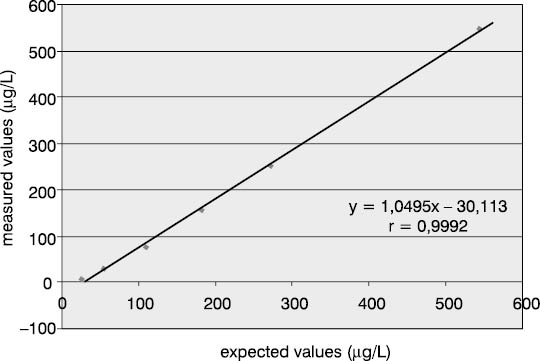
Figure 2. Dilution test for P1NP assay in pool serum with P1NP value of 544.8 mg/mL.
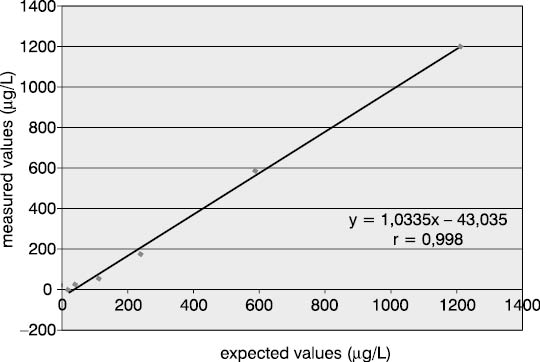
Figure 3. Dilution test for P1NP assay in pool serum with P1NP value of >1,200 mg/mL
Interferences
Measurement accuracy was examined by measuring P1NP concentrations in the sera supplemented with increasing concentrations of interfering substances. The subject of our examination were the most frequent interferences in human sera that are caused by hyperbilirubinemia, hyperlipemia and hemolysis. The data presented in Figures 5, 6 and 7 show negative deviation of results due to the effect of these interferences. An interference was established if the substance concentration caused >10% bias in results (this is a widely recognized limit for analytes with unknown biological variability). P1NP value decreased by >10% was measured in samples with bilirubin ≥610 µmol/L, triacylglycerol ≥15.0 mmol/L and hemoglobin ≥1.61 mmol/L.
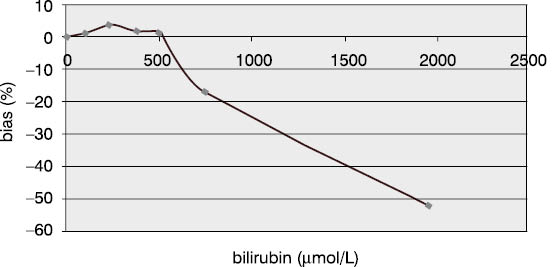
Figure 4. Effect of bilirubin on the P1NP assay accuracy. (P1NP=226.3 mg/mL)
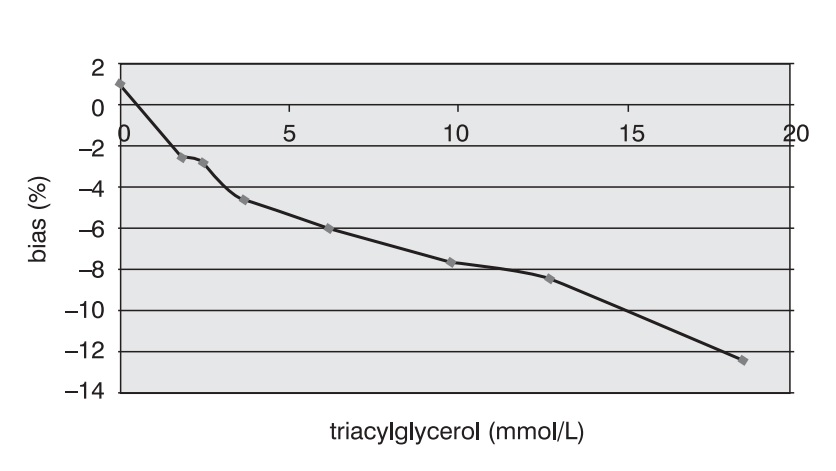
Figure 5. Effect of triacylglycerol on the P1NP assay accuracy. (P1NP=28.7 mg/mL)
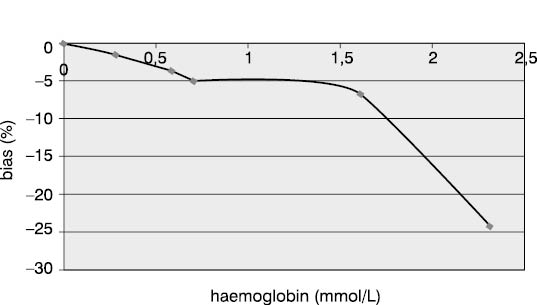
Figure 6. Effect of hemoglobin on the P1NP assay accuracy. (P1NP=28.9 mg/mL)
Table 5. Effect of bilirubin on the P1NP assay accuracy

Table 6. Effect of triacylglycerol on the P1NP assay accuracy

Table 7. Effect of hemoglobin on the P1NP assay accuracy

Discussion
As a noninvasive and easily available method, the measurement of bone mineral density (BMD) has created new possibilities for investigating metabolic bone diseases. It has also encouraged biochemical and pharmaceutical studies, and current realistic expectations are that biochemical markers of bone metabolism are to offer some clinical advantages over BMD. Such reflections may be supported by the fact that, despite good precision of the BMD method, one year is necessary (for slow bone remodeling even two years) for changes in bone density to be observed with 95% reliability. This problem is not noticed in large clinical studies where significant bone changes in a group are observed after six months (2,3,19), but rather in individual therapy monitoring (20,21). The specificity and sensitivity of bone markers are valuable characteristics that may help overcome the foregoing BMD disadvantages.
The novel P1NP assay allows for the measurement of total (intact) propeptide, a bone formation marker, through the ECLIA (Roche Diagnostics) technique involving two monoclonal antibodies, unlike radioimmunochemical commercial PINP method that detects components with only one antibody. Therefore, clinicians' expectations that the use of this method is to allow for therapy verification and modification in a time span shorter than half a year are quite warranted (12,13).
Our study was conducted with the aim to examine analytical properties of the method prepared for an automated closed-system analyzer. The method ensures simple performance of all analytical procedures, and offers advantages in standardization of laboratory procedures and integration into the laboratory information system.
Having been unaware of the entire intra-individual and biological variability of P1NP concentration, we were not able to establish the criteria for more reliable assessment of imprecision and inaccuracy. The accepted criteria for analytes with known variability data are: allowed imprecision limits amounting to less than a half of intra-individual variation (CV<½ CVintra), and the allowed inaccuracy limits amounting to less than one fourth of the total biological variation (bias % <¼ CVB) (22). The manufacturer states, supporting it with references, that circadian and seasonal changes of P1NP concentration show approximately 6% variation. We reduced this variability to the minimum by the sampling method employed, as all blood samples were collected at the same time of the day (between 7 and 10 a.m.) and at the same time of year (within 15 days). The data regarding some other bone markers (e.g., C-terminal telopeptide) revealed 9%-10% intra-individual variability (22). The manufacturer declares 1.8%-2.9% imprecision for P1NP, and our results were consistent with the CV ranging from 1.4% to 2.3%. Results for the CV for between-run imprecision were more surprising (1.4%, 1.7% and 2.0%) than for within-run imprecision (2.1% and 2.3%), which may be attributed to the more homogeneous and better prepared control sera in comparison to laboratory-prepared serum pools.
Examination of inaccuracy in control samples yielded values that did not exceed 10% bias at any concentration level in relation to the mean value declared by the manufacturer. Such a result was completely satisfactory. Moreover, none of the measurements performed during 10 days exceeded the limits of ±1SD, which is a criterion of acceptability in daily control performance.
Examination of linearity by the dilution test confirmed linear relationship in the analytical range (r>0.9) with proportional relation between the expected and measured P1NP concentrations (a=1.049 and 1.033). Also, the manufacturer's recommendation was confirmed that the P1NP values exceeding the upper measuring range limit are to be diluted only at a 1:2 ratio. As evident from the linear regression in Figures 2 and 3, each additional dilution took us further from the initial concentration, as expressed by a substantial constant error (b=-30.11 and -43.04), explaining why the error increased with higher dilution. Furthermore, the manufacturer's instructions particularly specify that non-linear relation is observed in diluted samples from patients with renal insufficiency. Indeed, serum pools with a high P1NP content included samples collected from patients on continuous hemodialysis.
The concentrations of interfering substances that caused more than 10% bias did not entirely comply with the manufacturer's declarations. The effect of hemolysis was observed as a negative interference at a hemoglobin concentration exceeding 1.61 mmol/L, which was a concentration higher by 32% than the declared 1.1 mmol/L. Lipemic and icteric sera also demonstrated negative interferences in case of the content of triacylglycerol ≥15.0 mmol/L and bilirubin ≥610.0 µmol/L, which was by 35% and 46% lower than the concentration declared by the manufacturer (22.8 mmol/L and 1112 µmol/L, respectively).
In conclusion, the new ECLIA method for P1NP determination demonstrated very good analytical characteristics for routine laboratory use. It is a simple and reliable assay with interferences recorded only in case of extreme hyperbilirubinemia, hyperlipidemia and hemolysis. Our results were consistent with literature data (24,25). The analyzer and computer equipment are test adjusted and guide the user safely through the analytical procedure. The comprehensive analytical properties of the P1NP assay by the Roche Diagnostics provide a prerequisite for clinical trials that are to assess its clinical applicability.