Introduction
Within the last few years tandem mass spectrometers (MS/MS), also known as “triple quadrupole” mass spectrometers, matured significantly to reliable analytical routine instruments. With these detectors, especially if coupled to high performance liquid chromatography- (HPLC) based sample preparation techniques (HPLC-MS/MS), quantitative and qualitative analysis of small organic molecules – xenobiotics as well as endogenous metabolites – became feasible in the femtomole range. Hence they became widely applied in pharmaceutical industry, research- orientated institutions, and – within the last decade – in clinical laboratories. HPLC-MS/MS based therapeutic drug monitoring (TDM) emerged less than two decades ago and is currently mainly focused on controlling immunosuppressant drug levels, as well as anti-retroviral medications and psycho-pharmaceutics. Generally, accurate measurement of analytes to be monitored is in TDM a necessary prerequisite for successful patient care. At the present time, most of the widely applied antibody-antigen-based assays (immunoassays) do not satisfactorily meet this criterion due to several reasons. Frequently, cross reactivity of commercialized antibodies with molecules structurally similar to endogenous drug metabolites or drugs of the same analyte class leads to an overestimation of the targeted drug. In the case of immunosuppressant TDM, this lack of assay specificity results in a deviation (bias) easily reaching an average of 20 to 40% (1-3). Furthermore, assay imprecision and sensitivity often hardly meet clinical needs, especially if therapeutic ranges are lowered in combined therapy approaches. A remarkable example in this context is the one of commercially available tacrolimus assays which have in the meanwhile become well known to perform insufficiently in patients with a hematocrit level below 35% by grossly overestimating low tacrolimus levels. This can even lead to false positive results that may reach concentrations within the therapeutic range (4-9). It is highly surprising but this assay is still widely applied in routine clinical laboratories, as evident in the latest proficiency scheme statistics (10). Within the last year, an average of 54% of all laboratories (N = 353) participating in the mentioned UK-based testing scheme used this particular assay. In comparison, only 16% of laboratories took part in the HPLC testing group that included HPLC-UV, HPLC-MS and HPLC-MS/MS platforms.
This clearly reflects the current position of HPLC-MS/MS in routine clinical TDM. Although the superior performance of HPLC-MS/MS assays (improved precision and accuracy, higher specificity and increased sensitivity resulting in reduced sample volumes and lower limits of quantification) has been clearly demonstrated over the past years (this technique is considered the gold standard for immunosuppressant TDM), still not too many laboratories have switched to this technology. The reasons are quite clear – mass spectrometry is said to be demanding in terms of operator skills needed and the financial burden of hardware purchase. In addition, if implementing such a technique from the scratch, quite a prolonged experimental stage awaits the experimenter before the thorough final assay validation can be carried out. Finally, highly automated immunoassays are said to have shorter turnaround times than HPLC-MS/MS assays, which does not hold true for the latest generation of high throughput approaches.
In the following chapters, the authors will discuss how the successful transfer of such analytical platforms can be pursued to a routine clinical laboratory environment characterized by highly automated analyzers. This overview will concentrate on targeted analysis setups as realized in TDM. A special emphasis will be given to immunosuppressant TDM (11-14), since this is a novel core expertise of our laboratory. For screening approaches as realized in neonatal diagnostics, toxicology, forensics, proteomics, and metabolomics, the audience is referred to the literature (15-25).
Needs of the clinical environment
A routine clinical laboratory environment differs from most industrial or research oriented setups by (i) possible high risks for patients associated with any kind of qualitative and quantitative analysis failure, (ii) encountering highly complex and non-standardized sample matrices like whole blood, plasma, and urine from non-healthy individuals, (iii) high demands to assay robustness and stability, (iv) assay execution by technical personnel, (v) demand for short turn around times (within half a day in the case of TDM). Within the last decade, EU legislation tried to meet this challenging situation by implementation of the In Vitro Diagnostic Directive (IVDD) 98/79/EG (26,27) which has been transferred into national legislation within the last years. As a consequence, a medicinal device used for in vitro diagnostics including any instrumentation, assay or assay component (i.e. a calibrator) has to undergo a performance evaluation study to prove the fitness for purpose of the device or assay. This validation aims toward a declaration of conformity (annex 3 of the directive) by the manufacturer indicating unequivocally that the “devices must meet the essential requirements set out in annex I which apply to them, taking account of the intended purpose of the devices concerned“ (article 3 of the directive). If this holds true, any “devices, other than devices for performance evaluation, considered to meet the essential requirements referred to in article 3 must bear the CE marking of conformity when they are placed on the market” (article 16 of the directive). The CE marking is a mandatory sign used in the European Community to indicate that a certain product or product group has conformed to health and safety requirements defined by the related European directives. It should not be mistaken with the scientific abbreviation used for capillary electrophoresis. In the case of an analytical assay, a performance evaluation should at least include a thorough validation of the analytical platform (e.g. according to FDA „Guidance for Industry, Bioanalytical Method Validation” (28) and GHTF “ Quality Management Systems – Process Validation” (29) guidelines) and risk analysis (e.g. failure modes and effects analysis as published by the GHTF in the “Implementation of Risk Management Principles and Activities Within a Quality Management System” guideline (30)). In summary, the aim of performance evaluation is to demonstrate that the designed IVD device (e.g. the HPLC-MS/MS platform) meets the requirements of Annex I of the Directive which is the basis for the declaration of conformity. The “in-house privilege” of the Directive, which is addressed in article 1.5 by stating “this Directive shall not apply to devices manufactured and used only within the same health institution and on the premises of their manufacture, or used on premises in the immediate vicinity without having been transferred to another legal entity. This does not affect the right of a Member State to subject activities to appropriate protection requirement”, might be applicable to single-unit analytical platforms (e.g. HPLC-MS/MS hyphenations, PCR assays …) which operate solely with local (e.g. within one medical center) samples. However, due to national regulation the interpretation of the term “in-house” differs within the EU. Currently, the whole issue seems unresolved and further discussions will hopefully lead to clarified regulations for novel applications.
Introduction to mass spectrometry instrumentation
Analyte Ionization
Mass spectrometry is based on the formation, selection and transport of ions in the vacuum of a MS instrument. The following paragraphs shall serve as a short overview to provide an insight into current technical solutions of analyte ionization and selection, as well as of connecting a MS to chromatographic devices.
During the past decades, different methodologies have been developed for ion formation and ion selection of analytes and a variety of strategies have evolved to combine analyte separation techniques with mass spectrometry (Figure 1).
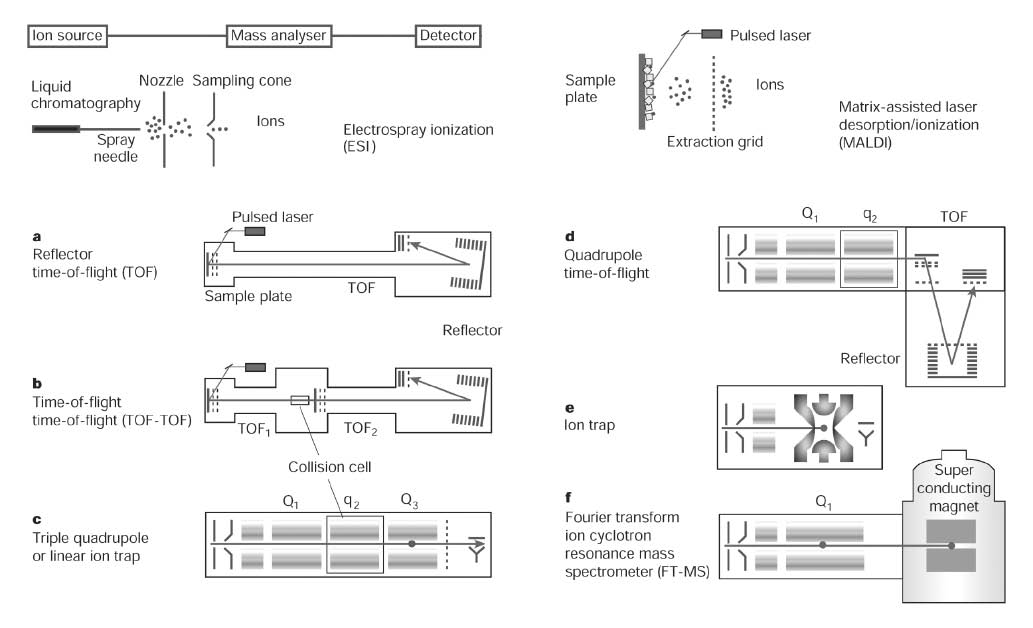
Figure 1. Schematic overview of ionization techniques and ion selection devices used in bio-analytical mass spectrometry. Different instrumental configurations (a-f) are shown with their typical ionization sources (left column ESI, right column MALDI). a, Reflector time of flight (TOF) instrument used if high mass accuracies are desired. b, TOF-TOF instrument allowing analyte fragmentation between two ion selection processes. c, As for the TOF-TOF MS a triple quadrupole (QqQ) instrument combines two ion selection processes allowing, among others, selected reaction monitoring (SRM) experiments. A linear ion trap (dot in Q3) can be used to collect and read out ions generated in the collision cell. d, In a quadrupole TOF (Q-TOF) instrument (hybrid mass spectrometer), the front part of a triple quadruple instrument is combined with a TOF as a readout ion selector. e, In (three-dimensional) ion trap instruments ion capture, fragmentation and ion read out (usually by a scan) allows to generate MS/MSn spectra. f, The FT-ICR-MS instrument traps ions by the aid of a strong magnetic field. It can be combined with a linear ion trap (quadrupole with dot) for efficient isolation, fragmentation and fragment selection prior to the FT-MS section. Reprinted by permission from Macmillan Publishers Ltd: Nature (24), copyright (2003)
Since only ions are analyzed, the most important reaction in MS might be the one that converts uncharged analytes of interest into gas–phase ions. The oldest, most used and probably best understood ionization technique is electron ionization (EI) in which analyte vapour is subjected to a bombardment by energetic electrons (typically 70 eV). Since analytes in EI have to be presented as vapours, it is the ionization of choice for GC–MS analysis. Over the past decades, a number of ionization techniques have been developed for analyses of non volatile and thermally labile compounds, with electrospray ionization (ESI) and matrix-assisted laser desorption ionization (MALDI) emerging as primary methods of choice. In ESI, ions are generated from a liquid at atmospheric pressure. The electrospray setup is technically simple – a hollow needle through which the eluent flows (usually 1–1000 µl/min) is charged with a potential. The high field at the tip of the needle produces a cone-shaped liquid meniscus from which emerges a spray of highly charged droplets. Subsequent evaporation of the droplets results in ion formation. ESI has some very impressive attributes that allow its application to a wide variety of biological problems. The production of multiply charged species extends the dynamic range of the mass spectrometer to the range of 106 u allowing analysis of macromolecules. Furthermore, it can be considered a very “soft” ionization technique which does not destroy non-covalently bound bio-molecular complexes as proteins (31) and even whole viruses (32). ESI is probably the most utilized ionization source combined with any sort of analyzer for HPLC–MS and CE–MS analysis. (33,34). A considerable shortcoming of ESI, particularly in direct infusion experiments (DIESI), is its susceptibility to matrix and ion suppression effects, e.g. by high salt concentrations in biological samples or by high concentrated analytes which might hinder or deplete ionization of analytes (35-37). An alternative to ESI, often combined within one source housing, is atmospheric pressure chemical ionization (APCI). The ionization is initiated by a corona discharge from a needle, producing a fine plasma of reagent ions stemming from volatiles in the source (auxiliary gases and vaporized solvents). A complex reaction cascade leads to a most efficient ionization of analytes. APCI is known for its sensitivity, robustness, ruggedness and reliability, and much lower susceptibility to chemical interferences than ESI (33). A further emerging alternative to ESI is atmospheric pressure photo ionization (APPI), based on absorption of a high energy photon which is produced in a discharge lamp (38,39). Although all atmospheric pressure ionization techniques, i.e. ESI, APCI, and APPI have impressive attributes, one has always to bear in mind that all the three of them show compound class specific sensitivities – very low ion yields cannot be excluded in certain cases.
A distinctly different concept of introducing analytes into a mass analyzer forms the basis of MALDI (40). The analyte is co-crystallized with a matrix and ions are formed by laser irradiations. An outstanding feature of MALDI is the pulsed nature of the laser which produces ion packages in discrete events of high sensitivity. Due to the short duration of these pulses, the number of utilizable mass analyzers is limited as high scanning rates are required. MALDI is the method of choice for high throughout analysis since target plates loaded with hundreds of samples can be used. Its relatively high tolerance to salts and buffers makes it the method of choice for analyzing complex biogenic matrices. The major drawback of MALDI lies in the nature of utilized matrices, especially if low-molecular weight compounds have to be analyzed. Generally, as atmospheric pressure ionization (API) techniques as ESI, APCI, and APPI are “soft” ionization technique producing mainly spectra with hardly any fragmentation, multistage ion analyzers as QqQ, Qq–TOF or ion–traps (see below) have to be used to obtain fragment ions that aid analyte identification by comparison with reference material.
Ion selection
Transmission quadrupoles are used as mass filters by applying precisely controlled voltages to opposing sets of poles. By ramping the voltages on each side of the poles, a complete range of masses can be passed to the detector in a time dependent manner. Quadrupoles were the most common analyzers in the past, particularly in combination with an ion source which produces structurally significant fragments as EI in GC-MS platforms. Although quadrupoles can operate up to masses > 4000 u, they are best suited for applications < 1000 u. One notable disadvantage of a quadrupole mass analyzer is a relatively slow scanning rate (< 4000 u/s). Thus, in full scan mode only a small fraction of available ions is used, a fact which makes them unsuitable for modern high speed separations with appreciably smaller peak widths. Also, they cannot be used as final mass selectors in combination with MALDI. However, the situation appears totally different when three quadrupoles are arranged in such a way that a central non-resolving quadrupole is flanked by two transmission quadrupoles forming a tandem mass spectrometer – also known as a triple quadrupole (QqQ) mass spectrometer. This setup allows controlled ion fragmentation in the second quadrupole which is used as a collision cell. The obtained secondary ion distribution might serve as a set of structural parameters in analyte identification. Furthermore, the QqQ setup allows combining ion selection, ion reaction, and ion scan processes to novel experiments, e.g. a highly specific product ion, precursor ion, or neutral loss scan modes. The selected reaction monitoring (SRM), a targeted analysis experiment of highest sensitivity and accuracy, is the methodological backbone of the application of mass spectrometry in forensics, pharmaceutical industry and clinical chemistry, which is to be discussed in this overview (33,34,41).
Alternatives to transmission quadrupoles are Paul ion traps which can be technically considered as variations of the general quadrupole mass filter design. Ions are confined (“trapped”) in these devices by electrodynamic focusing. In contrast to a quadrupole, where ions have a stable trajectory on their way to the detector, trapped ions are forced to leave the trap by putting them in unstable orbits through increasing the rf–voltage. The capability of ion traps to perform analyte collision-based repeated MS/MS experiments (MSn with n theoretically up to 10) within the cell, their ease in use, and their relatively low cost have made them rugged workhorses in many laboratories. Notably increased quantitative performance and dynamic range have been gained by the development of linear ion traps – two-dimensional Paul ion traps confining ions in axial dimension by means of an electric field at the ends of the trap. With such traps, benefits are mainly associated with the optimized volume of the mass analyzer (42). TOF mass analyzers, in principle some of the simplest devices in mass spectrometry, separate ions based on their velocity which is mass dependent. All ions are formed at once in the ion source and subsequently accelerated through a fixed potential. Hence, small mass ions arrive in the detector earlier than large mass ions. A common variation of TOF incorporates an electrostatic mirror, a reflectron, into the field-free region to compensate for effects of kinetic energy distribution of initial ions. The TOF analyzer gained great popularity in the early days of MS, but, as it needs a pulse of ions, was not compatible with available ionization methods at that point of time. The development of new pulsed-ionization techniques as MALDI led to a TOF detector renaissance in the 1990s. Nowadays it is mainly used as “readout” mass analyzer, combined with either another TOF, an ion trap, or – most frequently – with one or two quadrupoles (Q–TOF or Qq–TOF) preceding it. These hybrid mass spectrometers stand out through an unlimited mass range, exceptionally high scan rates up to 106 u/s, and high resolving power resulting in mass accuracy in the ppm range. Therefore, they are the technique of choice for applications demanding high throughput at utmost efficiency, as it is the case in proteomics and metabolomics (24,25,34,43-45).
Hyphenation to chromatographic separation systems
The hyphenation of HPLC and MS allows the analysis of a wide variety of compounds including thermo-labile and high molecular weight analytes which cannot be addressed by GC-MS. A broad range of HPLC stationary phases, both in terms of column dimensions and surface modifications, are commercially available allowing optimization of chromatographic separation to the matrix under investigation. The latest developments in this field also include the recent introduction of “ultra–performance” hardware, which may lead to a significant reduction in analysis time. Coupling liquid chromatography to mass spectrometry limits HPLC solvents to volatile buffers and organic additives in order to avoid salt precipitation in the mass spectrometer. Hence, sodium/potassium phosphate buffers, frequently used as eluents in HPLC-UV, had to be replaced by ammonium formiate or acetate systems.
HPLC-MS/MS Instrumentation setup
Mass spectrometers are impressively complex and expensive analytical devices. Nevertheless, setting up analyte-specific mass spectrometry conditions is only a minor part of the successful establishment of a quantitative analytical routine HPLC-MS/MS assay with the MS serving solely as a detector. Due to its nature, especially its sensibility to contaminations and environmental fluctuations of any kind, a successful application highly depends on sample pre-treatment and controlled environmental conditions. Air-conditioning of the mass spectrometry laboratory is mandatory, especially if a small room is chosen. Gas and pressurized air supplies have to meet the requirements of manufacturers, which might exceed the qualities commonly used in a routine laboratory environment. Complications in the analysis of complex “real world” samples might arise from chromatographic interferences, matrix effects, adduct and cluster formations, and ion suppression by competing metabolites or other matrix constituents. Hence, a thoroughly validated sample preparation protocol based on patient specimen is of outmost importance to maintain the desired long-term assay performance.
Quite often experimental parameters can be optimized from reasonable good starting conditions found in literature. This includes HPLC parameters as mobile phase (solvents, solvent additives, buffer concentrations, pH …) and stationary phase (column packing material, column dimensions, separation temperature …) properties, ion source settings including which ion to choose as a parent ion, and which ion reaction to monitor (selected reaction monitoring – SRM). The necessary manual tuning experiments are nowadays usually supported and guided by the mass spectrometer software. In addition, any of the major mass spectrometer providers is eager to help with the expert knowledge of their application specialists if novel assays have to be developed.
The design of the platform – especially the selection of hardware components has a strong influence on the overall success of assay introduction. The workflow from the primary crude sample to the final sample solution in the HPLC vial has to be planned as carefully as the setup of the chromatographic devices representing the final sample purification steps. Based on the sensitivity of the available mass spectrometer, the chosen experiment (e.g., a SRM), and the knowledge of the analyte target concentration to be monitored in the specimen, either sample pre-concentration or sample dilution has to be performed as a primary sample preparation step. The degree of automation and the batch size to be processed will depend on the needs of the laboratory as well as on available instrumentation. High analyte recoveries from matrix have to be achieved to ensure assay robustness and precision. The use of internal standards with the highest possible physico-chemical similarity to the targeted metabolites is another must in HPLC-MS/MS assay development. Finally, the communication of instrument software to the laboratory information system (LIS) has to be established, if possible. A flowchart summarizing the complete analytical process from the patient sample to the quantitative LC-MS/MS result is given in Figure 2.
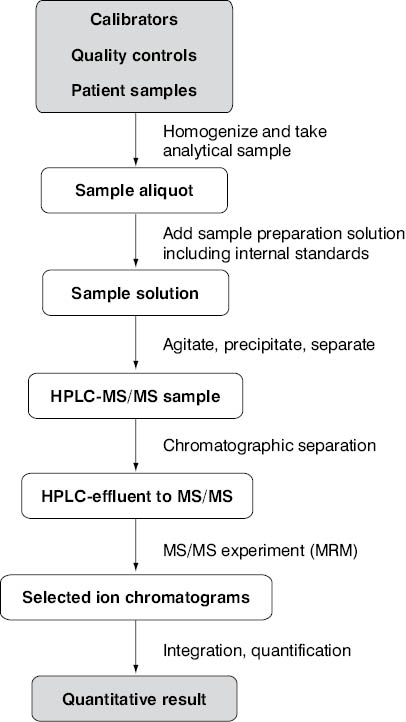
Figure 2. Process summary of an analytical LC-MS/MS platform producing quantitative assay results.
Sample preparation
Endogenous metabolites, as well as xenobiotics, are often either bound to plasma proteins or incorporated into cell (i.e. erythrocyte) membranes. Hence, quantitative release of analytes from these matrix constituents is a prerequisite for successful analysis. Disruption of cell membranes can be supported either by an osmotic shock (addition of distilled water) or by the addition of divalent heavy metal cations like zinc or copper. Protein unfolding and subsequent precipitation is usually carried out by the addition of organic solvents and is aided by the abovementioned cations (46). In most cases, acetonitrile or methanol in final concentrations > 50% (v/v) is employed. For whole blood specimens, as encountered in the case of immunosuppressant TDM (except for mycophenolic acid), both approaches are combined. A moderate (usually 1 + 2) dilution of the specimen (i.e. calibrator, control and patient sample aliquots) with a zinc sulfate/methanol mixture is most often employed (47-50). An alternative two step protocol using acetonitrile in the second dilution step (final dilution 1 + 14) was successfully implemented by Keevil and coworkers (51,52) by using only a 10 μL sample aliquot and operating in a microtiter plate. In the meanwhile, this method has spread in the community and has been successfully applied in different modifications (53,54). Another noteworthy protocol was presented by Annesley and Clayton who added an aliquot of water to the sample prior to protein precipitation to prevent sample agglutination (55). During work with plasma/serum specimens and organic, solvent-based samples, protein precipitation protocols have been found to be sufficient in most cases. Generally, care must be taken that the sample becomes completely homogenized during precipitation step by vigorous agitation; any formation of clumps impairs assay quality significantly and must be avoided. Removal of cell debris and denaturated macromolecules is performed by centrifugation, a stable and hard precipitate is preferred to allow simple decanting of supernatant to the HPLC vial serving as a final sample container. The sample solution has to be clear and without visible contaminations. As protein precipitation is invertely correlated with temperatures, employing cooled centrifuges (i.e. 4 °C) yields improved sample quality.
One of the most striking differences between chromatography- based assays and immunoassays is the use of internal standards which have to be added in the sample preparation step. If added correctly with the precipitation solvent, they compensate for losses during sample preparation procedure caused by evaporation of organic solvent, handling errors, or declining chromatographic performance if extraction steps are involved. Additionally, they compensate for the inherent imprecision of the sample introduction system, temporary fluctuations of the ion formation process and – most importantly – other matrix effects as ion suppression if co-eluting with analytes. Analyte/internal standard peak ratios have to be well balanced to avoid any assay bias due to ion suppression effects caused by internal standard. To meet the criteria of outmost physico-chemical likeness to analytes, these compounds are either stable isotope-labelled derivatives or structural homologues of analytes. Stable isotope labelling is performed by deliberately introducing 2H or 13C isotopes into molecular scaffold by quantitatively replacing certain 1H or 12C atoms (56). By doing so, a shift of the molecular mass is introduced, discriminating the internal standard from the analyte in mass spectrometer. If stable isotope labeling is not a choice due to the nature of the analyte (i.e. a fungal metabolite produced by fermentation as in the case of most immunosuppressants and antibiotics), a structural homologue can be used. In the case of immunosuppressant TDM, ascomycin most often serves as an internal standard for tacrolimus, and cyclosporine D for cyclosporine A. In both cases, internal standards have an identical ring system size and geometry. They feature only subtle differences in one side chain – a methyl group in cyclosporine A/D and a methylene group in the tacrolimus/ascomycin case.
Sample preparation is performed in batches with quality control samples running in each batch. Batch size depends on available instrumentation; a limitation, for example, can be the number of vial places in the centrifuge rotor. To allow unequivocal sample identification throughout the whole pre-analytical phase, the use of individual reaction cups and HPLC vials can be beneficial. If sample mix-up can be excluded by other precautions (i.e. by two-dimensional barcodes), the use of 96-well microtiter plates simplifies workup procedures significantly (51,52,57,58). Specimen aliquots can be either placed into the wells by hand or by the aid of a sample robot (59-61). Due to their broad application in pharmaceutical industry, different types of well plates, sealing devices, well plate shakers, and well plate centrifugation rotors are available. Modern auto samplers allow drawing sample aliquots directly from microtiter plates, even if a precipitate is present. Hence, the time consuming manual transfer of a sample from the precipitation tube to the HPLC vial can be avoided.
Sample purification
Protein precipitation and cell lysis leave a sample matrix much too dirty to be directly introduced into the vacuum of a mass spectrometer. It consists of both low and high molecular weight constituents covering a broad range of polarities; hypdrophilic (i.e. amino acids, organic acids, peptides, sugar derivatives …), ampholytic (i.e phospholipids …), and hydrophobic (cholesterol, triglycerides, lipid rafts ….) metabolites are present either in solution or as vesicles. Hence, both for lipophilic (e.g. drugs, endogenous steroidal hormones) and more hydrophilic analytes (e.g. organic acids, catecholamines), a two step sample purification protocol combining solid phase extraction (SPE) and analytical RP-HPLC is most often applied to provide reproducible detector responses.
The use of offline SPE for sample purification or analyte enrichment is a well established technique evolving over the past decades as alternative to liquid-liquid extraction protocols. A lot of different column materials are available, ranging from classical reversed phase materials (RP-18) and lipophilic polymers to anion (SAX) and cation exchange (SCX) phases. This technique found its application in most analytical laboratories and has been applied for nearly any matrix (62,63). In the clinical laboratory, it is often used as sample enrichment technique in the context of HPLC analyses with UV of fluorescence detection. It can be applied in different formats, ranging from single SPE columns to 96 well plates (64). After the preconditioning of SPE material, a sample aliquot is added. Subsequent washing steps remove unwanted matrix constituents. Finally, the analyte of interest is eluted from the cartridge, which is usually discharged after single use. Solvent flow through the SPE stationary phase bed is usually supported by applying a gentle vacuum or by the aid of centrifugal forces. However, it is a manual method with all its drawbacks – it is time consuming and demanding in terms of personnel involvement. If a higher sample throughput is desired, offline SPE should be replaced by online methods. This implies that it has to be integrated into the HPLC setup prior to the analytical column by using a column switching design. As a consequence, SPE columns of increased durability and pressure stability have to be used and a solvent flow setup allowing the controlled transfer of all analytes from the first to the second column element is needed. The most significant chromatographic difference to offline SPE is that, if operated at high flow rates (< 4 ml/min), some of the commercially available online SPE columns (e.g. the RAM – restricted access material – based products) can show both size exclusion and adsorptive effects (65,66). Hence, macromolecular matrix constituents are easily removed, even if they show an affinity to the surface of the SPE material in a conventional SPE setup, as denaturated proteins can do.
Online column switching was introduced to liquid chromatography more than forty years ago (67). Within two decades it found its way from industry to clinical analysis starting with immunosuppressant TDM (68,69), besides other applications (70,71). Its broad application in mass spectrometry-based TDM of immunosuppressants started less than ten years ago, when several research groups presented more or less simultaneously their first online-SPE-HPLC-MS and online-SPE-HPLC-MS/MS assays (48,50,72-74). A possible layout of an online SPE-HPLC-MS/MS setup – as realized in our laboratory – is given in Figure 3.
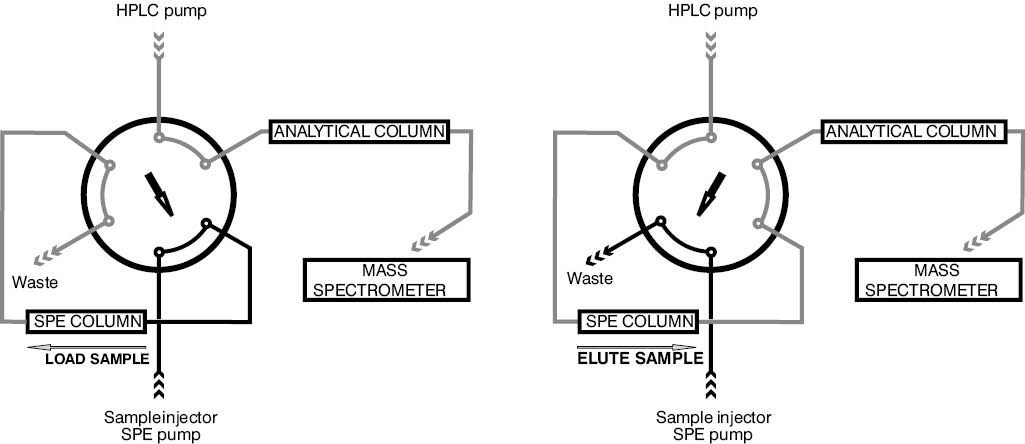
Figure 3. Schematic overview of the column switching technique frequently applied in HPLC-MS/MS setups. First the injected sample aliquot is carried to the SPE column by the aid of the SPE pump mobile phase. Analytes are retained on the SPE column whereas matrix constituents are flushed into waste. Switching the 6 port valve leads to the back flush elution of the analytes from the SPE column onto the analytical HPLC column by the aid of the HPLC pump mobile phase mixture. Here, analytes are separated from the main sources of ion suppression - the solvent front and lipophilic matrix constituents co-eluting from the SPE column.
Both stationary phases, the online SPE column and the analytical HPLC column, are fed by a separate HPLC pump, allowing mobile phase switching or mobile phase gradient formation in both chromatographic dimensions. The transfer from one to the next column is aided by switching a six-way valve. Since sample introduction and sample purification on the SPE is usually performed with the same mobile phase, the second solvent channel (if a binary pump is used) of the HPLC pump serving the SPE column can be used to clean/regenerate the SPE stationary phase after each analysis (i.e. by flushing it with methanol). The analytes retained on the SPE are transferred to the second chromatographic step with the aid of the solvent delivered by the HPLC pump; the reversion of flow direction (“back flush mode”) leads to a sharpened elution profile from the SPE. Due to the availability of two (binary pump) or more solvent channels on the HPLC pump, any desired mobile phase gradient can be formed. This is of special importance if isobaric analytes have to be separated or if drug metabolites susceptible for ion source fragmentation have to be separated from the parent drug under investigation (48,75-77). The cycle time of this setup depends on the SPE step (about 1 min), the time needed for proper analyte separation in the second chromatographic dimension if needed (i.e. if isobaric analytes have to be separated), and the time to regenerate stationary phases. In our laboratory setup used for immunosuppressant TDM, a total chromatography time of 2.6 min has been realized, with the analyte peaks eluting between 1.2 and 1.5 min (Figure 4).
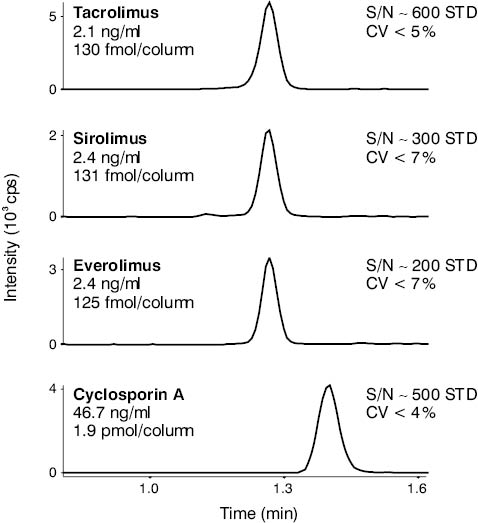
Figure 4. HPLC-MS/MS derived chromatogram of a low level multi-component immunosuppressant TDM calibrator. Both the CV of repeated measurements (N = 6) and the S/N numbers show that this analyte level is well above the limit of quantification of this particular assay established at our laboratory.
Alternatively to this two-dimensional HPLC setup, which ensures maximum purification of a sample prior to its entering the mass spectrometer, one dimensional HPLC setup is often realized. Such setup makes possible lower cycling times, while retention times below one minute were frequently reported for immunosuppressant TDM (51,52,54,60,61,78). This type of HPLC setup is significantly cheaper and easier to handle than an assay involving column switching technologies. Hence it is not surprising that it is the technological backbone of the currently only CE certified HPLC-MS/MS-based TDM assay on the market operating without offline SPE sample pre-purification. Drawbacks of this setup can be seen in an incomplete sample purification leading both to unwanted ion suppression effects and an increased pollution of the mass spectrometer. To circumvent these problems, the application of offline SPE-based sample purification protocols or high sample dilution ratios in the protein precipitation step can be beneficial. Furthermore, due to the increased contamination of the HPLC column by residual matrix components, only short column life times – usually below 1000 injections – are achieved. With the above described online-SPE-HPLC-MS/MS setup realized in our laboratory, SPE columns last about 2000 matrix injections and HPLC columns can be used for more than 6000 samples. This brings the HPLC consumable costs (including HPLC vials) close to 0.5 € per sample. This makes mass spectrometry, despite high costs for analytical hardware and laboratory adaptations, even in financial terms a strong competitor to immunoassay-based routine analytics, besides the well known qualitative advantages as improved accuracy, reduced imprecision, and reduced matrix effects.
A currently foreseeable trend in optimizing HPLC-MS/MS platforms toward higher throughput is the use of a column of smaller inner diameters packed with materials of decreased particle size (1.8 μm) to be operated at higher flow rates and increased temperatures. However, due to expectable higher backpressures, the hardware equipment has to be upgraded to meet these requirements. A second trend involves the coupling of two (or more if applicable) independent HPLC units to one mass spectrometer, commonly known as “multiplexing”. Herein, a HPLC unit is connected to the MS through a switching valve only in the time window of analyte elution from the analytical column. During sample injection, the online SPE step, and the SPE re-equilibration, this unit is separated from the MS allowing the other HPLC to be connected to the MS. Hence, the operating software has to be able to completely control two or more HPLC systems simultaneously (identical overlapping methods; the pumps have to be under full control even if being offline from the MS device). These requirements are usually not fulfilled by the controlling software of the MS. Currently such a setup has been realized by at least one independent vendor of HPLC equipment.
Analyte detection
In routine tandem mass spectrometry, the use of selected reaction monitoring (SRM), also known as multiple reaction monitoring (MRM), is the predominant MS/MS experiment. The HPLC effluent consisting of analytes, matrix constituents, and mobile phase is introduced to the ion source via a steel capillary serving as an electrode. Thus all ionizable matrix constituents become charged whereas the bulk solvent remains uncharged and has to be removed. Mobile phase additives, like volatile organic acids and salts (e.g. trichloroacetic acid, formic acid, acetic acid and their ammonium salts) facilitate the ionization process by providing ions. Analyte selection starts already in the ion source, since hardware parameters (i.e. the source temperature, declustering potential) are tuned in such a way that the relative amount of the desired analyte ion (i.e. the ammonium cluster ion in the case of immunosuppressant drugs) is maximized. Subsequently, this primary ion is selected within the first quadrupole. Due to the nature of this process, all ionized isobaric matrix constituents with the mass to charge (m/z) ratio identical to the analyte are also selected, whereas ions of different m/z values are ejected from the ion trajectory. By gas phase reaction in the collision cell, the primary analyte ion is degraded to a cascade of reaction products. This process can be optimized to increase the yield of the chosen fragment ion of the analyte and is tightly controlled by the MS settings. Subsequently, only the secondary ion m/z ratio is read out by the third quadrupole and transferred to a detector plate. This combination of primary ion formation (source) – ion selection (quadrupole 1) – fragment ion formation (collision cell) and fragment ion selection (quadrupole 2) is the basis of the high selectivity of tandem mass spectrometry. Traditionally two SRMs are recorded for an analyte, one serving as a quantifier and the other (usually the less sensitive one) being used as the additional quality control proving the identity of the analyte and hence named qualifier.
Given that only one SRM can be recorded at a certain time point (no simultaneous measurement!), the mass spectrometer software has to cycle through all desired MS/MS reactions on a millisecond timescale. The duration of data collection for each selected ion reaction, the dwell time, is an important parameter for optimizing an assay which has to monitor a series of analytes. One the one hand, the sensitivity of a mass spectrometer decreases with shorter dwell times due to a relative increase in noise. The dwell times below 50 ms are often not applicable although easily realizable with modern-day instrumentation. On the other hand, chromatographic peaks elute within seconds in fast assays, and peak widths of < 10 s are rather normal. Since it is well known in chromatography that an analyte peak has to be characterized by at least 10-15 data points to allow precise integration, associated SRM cycle times should be well below 1 s. Hence – as a calculation example using 50 ms dwell times on all transitions – not more than about a dozen SRMs can be monitored for co-eluting peaks. This translates to five analytes and one internal standard, if quantifiers and qualifiers are monitored.
Since the SRM approach focuses on single analytes, co-eluting matrix constituents as endogenous components (i.e. phospholipids, cholesterol, etc.) or xenobiotics (i.e. drugs of any kind), which may vary qualitatively and quantitatively from patient to patient, cannot be observed. As any matrix element can give rise to unwanted signal losses due to ion suppression (35-37), HPLC-MS/MS method validation protocols must address such issues in detail. Patient samples with the properties known to show analytical interferences in other routine assays (increased levels of hemoglobin, bilirubin, triglycerides, cholesterol, etc.) have to be checked for ion suppressive effects, as well as medications commonly used for patient care (i.e. antiviral or antifungal drugs in the case of transplant patients). Spiking experiments using problematic patient samples (i.e. highly icteric or lipemic specimens) enforced with the known levels of the analyte under investigation allow the testing of differences in analyte signal recovery compared to healthy subject samples treated identically, covering both ion suppression effects and matrix interferences in the extraction step. Syringe pump-based experiments introducing a steady flow of investigated analytes into the HPCL effluent between the HPLC column and the mass spectrometer by using a t-piece connector are another well evaluated possibility to investigate ion suppression effects (37). Samples from healthy subjects which are free from the analytes under investigation are spiked with xenobiotics to a clinically relevant concentration. Conventional sample preparation, as used for routine analytical samples, is applied and sample solutions are introduced to the HPLC-MS/MS system. Since the resulting chromatograms should appear as flat lines due to constant analyte flow from the syringe pump, any deviation from this ideal situation (which can be mimicked by investigating the injection of a solvent sample), equals a matrix-based signal disturbance. Additional peaks, which can be judged as cross reactions, are hardly observed. More often a sudden loss of analyte signal – the ion suppression – can be observed. If this takes place systematically, i.e. in any sample even if no xenobiotics have been added, alternative sample preparation strategies should be sought. Ion suppression effects in the presence of a drug frequently co-administered with the analyte under investigation are more critical. If chromatographical co-elution with the analyte occurs, irreproducible quantitative results of the TDM assay cannot be ruled out. In such case additional verification measurements should be carried out either by using changed chromatographic conditions or by adding a SRM of the possibly interfering substance to the experiment.
Data analysis
Raw data analysis of HPLC-MS/MS-based chromatograms usually includes a data smoothing step prior to fully automated peak identification. Integration algorithms are supplied with any mass spectrometers, usually whole batches (e.g. all runs of one day) can be processed within minutes. Nevertheless, peak integration should be checked as part of the technical validation process since deterioration of ion formation process, usually due to ion source contaminations or worn out transfer capillaries, quickly mirrors the loss of peak shapes. All analyte peaks are referred to the respective internal standard, and peak area ratios are the basis of analyte quantification. Whenever possible, commercially available CE certified calibration and control materials should be used; multilevel calibrators are a must for assay validation (at least if the FDA guideline on bio-analytical method validation (28) is applied).
Quality Control and Maintenance
Besides checking the precision and accuracy of an assay by monitoring quality control and calibrator data over time (Figure 5), a series of hardware checks should be performed to ensure the long term stability of the setup.
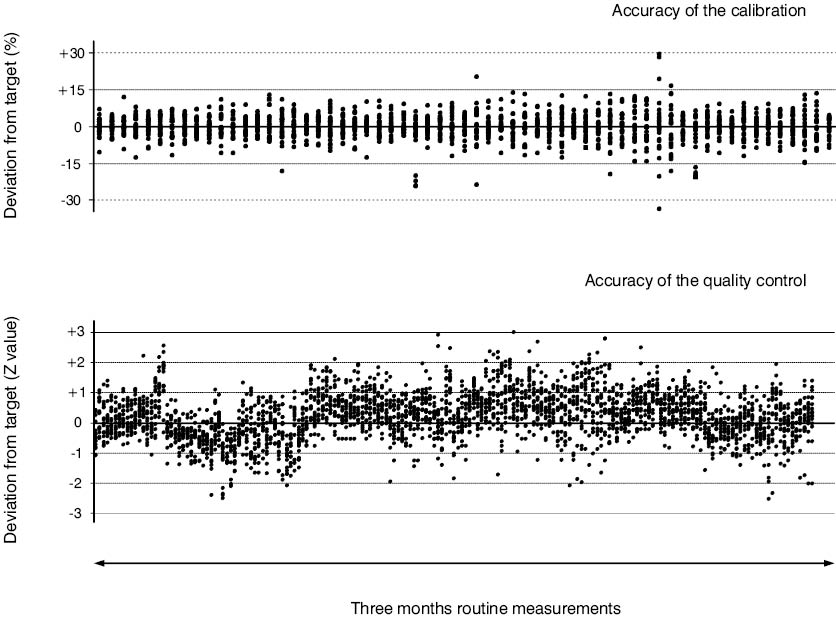
Figure 5. Long-time stability of the HPLC-MS/MS immunosuppressant TDM assay at Innsbruck. Standardized deviation plots of commercially CE certified multi-analyte calibrator and quality control materials containing cyclosporine A, tacrolimus, sirolimus, and everolimus summarizing a three-month measurement period. The multilevel (n = 6) calibrator data (64 time points with 24 data points at each) is presented as percentage deviation from the assigned target value. For successful calibration, 4 out of 6 data points have to be within the 15% margin. The multilevel (N = 4) quality control data (181 time points within 24 data points at each) is given as z-value deviation (2S ranges assigned by the manufacturer were used) from the assigned target value.
Pressure profiles of chromatographic runs have to be surveyed since the build up of back-pressure is usually an early sign of congestions of HPLC columns due to the precipitation of sample matrix. HPLC columns might block after prolonged use, and a preventive change can reduce the instrument down time. The ion source housing has to be frequently checked for visible contaminations, removable hardware pieces shielding the MS should be cleaned on a regular basis to avoid contaminations of quadrupoles. The quality of the vacuum relies on the pumping system; hence a frequent check on the oil quality of the first stage pumps is advisable. Regarding the stability of a mass spectrometer, ion transfer efficiency and mass resolution should be stable over quite long time spans under routine analysis conditions. Nevertheless, it might be advisable to check the MS/MS performance by running tuning experiments as suggested by the vendor’s guidelines. Last but not least, the stability of any mobile phases and sample preparation materials including the internal standard stock solutions has to be assessed, and the rules for sample storage have to be developed or derived from literature data. Recurrent personnel training sessions and well written operation protocols complete the package of quality control measures toward a stable and well working HPLC-MS/MS platform.
Comparability to immunoassays
For any of the immunosuppressant drugs monitored, a distinct method bias has been observed between HPLC-MS/MS methods and immunoassays of various producers. Even different immunoassay realizations provided by the same company can show significant differences in quantitative results if compared among each other (most likely due to different antibodies used and due to differences in detection methods) and to HPLC-MS/MS. These differences were not only described in the literature (47,48,49, 52), but are also mirrored by proficiency testing scheme results in Europe and Northern America.
Since assay deviations to the HPLC-MS/MS are mainly based on the cross-reactivity of immunoassay antibodies with drug metabolites (11,12,13,79,80), an observed bias is an individual parameter, strongly depending on the metabolization rate of the administered parent drug. Deviations from a patient to patient have to be expected, as well as bias fluctuations of individual patients if monitored over time due to, e.g., variations of the overall health state or due to changes in the cocktail of co-administered drugs. As a consequence, mean bias values show a high coefficient of variation, typically in the range of 20–30%. This makes “the method bias” as reported in the literature inefficient to escort clinicians through a method change if immunoassays are involved. Consequently, it is hardly useful to evaluate the impact of an analytical platform change on the used therapeutic ranges. To our personal conviction and from our own observations at our laboratory, only a prolonged parallel measurement of TDM data (several thousand data points are needed) on both analytical platforms – the “new one” and the one to be replaced, including the generation of longitudinal patient profiles, can give the involved clinicians the confidence needed for successful introduction of a novel analytical method like HPLC-MS/MS for immunosuppressant TDM.
Conclusion
Mass spectrometers are among the most expensive analytical devices usable for routine analysis in clinical laboratories. Nevertheless, they are competitive to immunoassays both in terms of assay quality and costs per analysis. Tandem mass spectrometry-based assays are highly selective and sensitive; the precise measurement of a targeted analyte without cross-reactions to any other structurally related or unrelated analytes is standard. Routine HPLC-MS/MS analysis in the femtomole range is feasible, making mass spectrometry-based assays even more sensitive than many currently available immunoassays. In the case of immunosuppressant TDM, the quantification limit can be easily lowered by a factor of 5–10 compared to any available immunoassays. Using an online-SPE-HPLC- based sample workup strategy, costs per analysis can be cut below 1 € and, with shorter column life times as in one-dimensional HPLC setups, a 2 € per sample threshold can be reached. This leaves still a gapping factor of 5-10 to commercial immunoassays, allowing a swift amortization of the initial hardware costs of about 250.000–300.000 € if the sample throughput is high enough. Taken together, HPLC-MS/MS-based target analysis is certainly a promise for the future of routine clinical analyses currently starting to become real. It can be expected that all major vendors will within the forthcoming years become more and more aware of this market. Hence the essential improvements in machine handling and software will become real and mass spectrometer packages will develop from research-oriented instruments to routine equipment. It can be expected that sooner or later several CE-certified assays will be available as they are nowadays for HPLC-UV and HPLC-FLD-based analyses, maybe even replacing them.