Introduction
During the last decade, a large number of studies have shown that detection of very low numbers of malignant cells, i.e. detection of minimal residual disease (MRD), significantly correlates with the clinical outcome in many hematologic malignancies (1). For most patients with newly diagnosed chronic myelogenous leukemia (CML), a complete cytogenetic response (CCR) can be achieved with imatinib mesylate therapy. But because of persistent malignant cell population that is present below the limit of detection by standard techniques, a proportion of them will relapse. This suggests that obtaining a molecular remission should be the goal of therapy and it is of critical importance and clinical utility to obtain high sensitivity of molecular testing. Ideally, techniques used for MRD detection should have a sensitivity level in the 10-5 to 10-6 range, be applicable to all patients with the disease, provide some quantification of the target, be rapid, inexpensive and readily standardized (2). Also, good interlaboratory reproducibility and standardization of reporting are of critical importance.
In CML patients who have achieved CCR by bone marrow cytogenetics and/or FISH nested PCR (nPCR) and quantitative real-time PCR (qPCR) are used for detection of BCR-ABL mRNA. There are inconsistent reports on the sensitivity and usage of nPCR and qPCR in monitoring of BCR/ABL transcript levels (3,4).
In this study, we compared the level of sensitivity of nPCR and qPCR in detection of BCR-ABL p210 transcripts in a controlled experiment of BCR-ABL-positive cell dilution model. Also, we compared and discussed two approaches in qPCR: absolute and relative quantification.
Materials and Methods
Cell line dilutions
For determination of sensitivity level, serial dilutions of K562 cell line (BCR-ABL-positive) in NB4 cell line (BCR-ABL-negative) were made. Dilution of positive cells was performed in 10-fold steps, from 10-3 (one positive cell in 1000 negative) to 10-7 (one positive cell in 10 000 000 negative). Bone marrow and peripheral blood samples of two CML patients on imatinib mesylate therapy were also tested by both methods.
RNA isolation and reverse transcription
RNA was isolated using QIAamp RNA Blood Mini Kit (QIAGEN, Hilden, Germany) according to the manufacturer’s instructions. One microgram of total RNA was used for cDNA synthesis using GeneAmp Gold RNA PCR Core Kit (Applied BioSystems, New Jersey, USA) according to the manufacturer’s protocol.
Detection of BCR/ABL p210 transcript
Nested PCR assay was performed according to BIOMED-1 protocol (5). PCR was performed with the following primers: first step: BCR-b1-A GAAGTGTTTCAGAAGCTTCTC C plus ABL-a3-B GTTTGGGCTTCACACCAT TCC, second step: BCR-b2-C CAGATGCTGACCAACTCGTGT plus ABL-a3-D TTCCCCATTGTGATTATAGCCTA. Both PCR steps were carried out in a 25 μL reaction volume containing: 1x reaction buffer (50 mM KCl, 20 mM Tris HCl, pH 8.3), 1.5 mM MgCl2, 200 μM dNTP, 10 pmol of each primer, 0.5 U of Taq DNA polymerase (Applied BioSystems, New Jersey, USA), and 1 μL of cDNA in the first step or 1 μL of first round PCR in the second step. The PCR amplifications were carried out under the following conditions: initial step of five minutes at 95 °C, then 35 cycles of 95°C for 30 seconds, 65 °C for one minute, 72°C for one minute, followed by a final extension step at 72°C for 7 minutes. The PCR products were analyzed on 2% agarose gel (Applied BioSystems, New Jersey, USA) stained with ethidium bromide (Sigma Chemical Co., Deisenhofen, Germany).
QPCR assay was made according to EAC protocol using primers and probe for TaqMan technology (6). Real-time PCR analysis for BCR-ABL and internal housekeeping gene ABL was performed using 7300 Real Time PCR System (Applied BioSystems, New Jersey, USA) with the initial steps of 2 minutes at 50 °Cand 10 minutes at 95 °C,followed by 50 cycles of 15 seconds at 95°Cand 1 minute at 60°C. Two qPCR approaches were used: absolute quantification (copy number ratios) and relative quantification. For absolute quantification plasmid standard curves were used (Ipsogen, Luminy Biotech Enterprises, Marseilles, France). To compensate for inter-PCR variations in the relative quantification study, normalization of target gene (BCR-ABL) with an endogenous control (ABL) was performed. All expressions were calculated using 7300 System SDS Software RQ Study Application (Applied BioSystems, New Jersey, USA).
Results
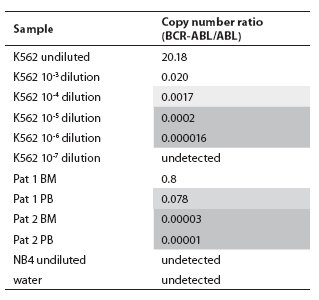
In the BCR-ABL-positive cell dilution assay, nPCR detected p210 transcript in 10-5 dilution (Figure 1) in 3 independent experiments. In the absolute quantification approach, the copy number ratio was expressed as BCR-ABL copies per copy of ABL. In the relative quantification approach, results are shown as relative expressions of normalized target gene in diluted cell lines and patients samples against normalized expression of target gene in undiluted K562 cell line. Both qPCR approaches showed a sensitivity of 10-6 (Figure 2, Table 1). Both nested and quantitative methods detected p210 transcript in bone marrow samples of CML patients. However, contrary to nPCR, qPCR also detected p210 transcripts in peripheral blood samples of CML patients, irrespective of the approach used. Transcript levels were lower in comparison to bone marrow samples. Analysis of samples in 3 independent experiments demonstrated the assays to be reproducible (mean difference of 3 measurements 0.16% for absolute quantification, 0.18% for relative quantification; standard deviation for absolute quantification 2.1%, for relative quantification 2.0%).
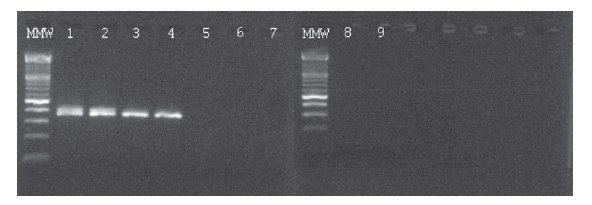
Figure 1. Ethidium bromide-stained agarose gel showing results of BCR-ABL p210 transcript detection in serial dilutions of K562 cell line in NB4 cell line and two patients on imatinib mesylate therapy using nPCR. MMW = molecular weight marker; 1 = undiluted K562; 2 = 10-3 dilution; 3 = 10-4 dilution; 4 = 10-5 dilution; 5 = 10-6 dilution; 6 = 10-7 dilution; 7 = NB4; 8 and 9 = water.
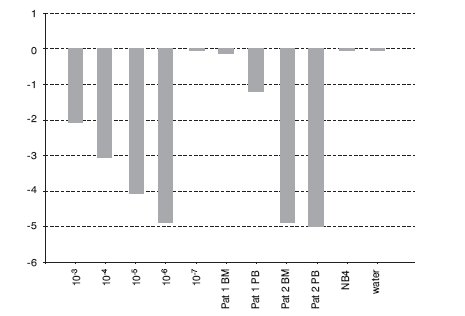
Figure 2. Detection of BCR-ABL p210 transcripts in serial dilutions of K562 cell line in NB4 cell line and two patients on imatinib mesylate therapy using qPCR with TaqMan technology (relative quantification, calibrator: undiluted cell line K562). BM = bone marrow; PB = peripheral blood.
Table 1. Copy number ratios of BCR-ABL p210 transcript determined in serial dilutions of cell line K562 in cell line NB4 and two patients on imatinib mesylate therapy using TaqMan technology. Light shadow = Minor Molecular Response range, dark shadow = Major Molecular Response range (according to refs. 7 and 8), BM = bone marrow, PB = peripheral blood.
Discussion
According to BIOMED-1 protocol, a sensitivity of 10-6 can be achieved using nPCR. Lower sensitivity of our nPCR assay in comparison to BIOMED-1 protocol can be attributed to a different dilution experiment. In BIOMED-1 protocol K562 RNA was diluted into HL60 RNA (RNA in RNA), whereas in our dilution experiment K562 cells were diluted in NB4 cells (cells in cells). In that way, we made the experimental conditions more resembling in vivo situation. Also, the pre-PCR steps, as RNA extraction and efficiency of the reverse transcription can be the source of lower sensitivity (9,10).
Both methods reached acceptable sensitivity for detection of MRD in CML. However, qPCR showed higher sensitivity than nPCR. The sensitivity that can be obtained by PCR analysis is dependent on several parameters, which include the number of cells investigated, the total amount of RNA analyzed and the number of PCR cycles (11). These inter-PCR variations can be compensated by using normalization of target gene with an endogenous control (ABL, GAPDH, B2M). Besides higher sensitivity, advantages of qPCR over standard nPCR for p210 transcript detection include a decreased turnaround time, decreased chance for post-PCR contamination, decreased variability of results (data collection occurs in the exponential phase of PCR reaction), high throughput, and possibility of obtaining quantitative results. In our experiment, both absolute and relative quantification methods showed equal sensitivity. Potential drawbacks of the absolute quantification method are that use of plasmid standards reduces the number of wells available for patient samples and increases the risk of contamination, also slightly increasing the costs. Relative quantification relies on the relative efficiencies of the target and control gene amplifications, so it is a prerequisite that the patient’s first diagnostic sample is routinely included. In that way this method can be used for determination of the relative level of MRD in comparison to diagnostic sample.
Whether using absolute or relative quantification, the determination of the trend in the quantitative numbers of residual BCR-ABL-positive cells over a period of time provides important therapeutic information in the follow-up of CML patients. In conclusion, we found the qPCR to be an appropriate, reproducible and robust method for MRD monitoring after achieving CCR in chronic myelogenous leukemia.