Introduction
Every science research starts with a detailed analysis of the field of interest, defining the clear aim and hypothesis, by thorough planning of the research design and the way of data collecting and data analysis, as well as the reporting of the results. For a successful research the choice of the representative sample is crucial (1). A good sample assures reliability of our results and conclusions that arise from them. By analysing some sample characteristics we actually want to have an overview of the situation in the population. In the most cases it is impossible to examine the population as a whole. Therefore, based on what we find out about our sample using the descriptive analysis we make conclusions for the population as a whole (2). This is the basic concept of, so called, inferential statistics. What is hereby understood is the fact that everything we conclude about the sample is reliably applicable to the whole population.
Let us presume, for example, that we want to know what the average cholesterol concentration in the population is. To answer this question we select a sample for which we believe that represents the population and in this sample we calculate the mean of cholesterol concentration. By random selection we have decided for the sample (N = 121) and we determine the mean of cholesterol concentration: 5.7 ± 1.4 mmol/L. In this case we use the arithmetic mean as a point estimate of cholesterol concentration in the population. The thing we want to know is the answer to the question: can we consider this calculated mean as a good estimate for cholesterol concentration in the population. Which statistical indicator points to that? What does the reliability of this estimate depend on? The confidence interval (CI) gives the answer to all these questions.
What is confidence interval?
In statistics, for any statistical measure, a confidence interval presents a range of possible values within which, with some certainty, we can find the statistical measure of the population.
Let us go back to the example of the average cholesterol concentration in the population. By random selection we have chosen one sample of 121 individuals and on this sample we have calculated the mean cholesterol concentration. Subsequently, we repeat the procedure and we take a new sample with a new arithmetic mean. We repeat sampling for 100 times and each time we calculate a certain arithmetical mean of cholesterol concentration. To each arithmetical mean we give an appropriate confidence interval. Out of a total of hundred related 95%-confidence intervals, 95% of them will contain the actual arithmetical mean of the population (μ). This is also the most accurate definition of a confidence interval.
As such, confidence interval is a realistic estimate of (in)precision and sample size of certain research (3). Therefore, we can consider confidence interval also as a measure of a sample and research quality. Many journals therefore require providing the key results with respective confidence intervals (4,5).
Confidence interval is defined by its margins of error. Depending on the confidence level that we choose, the interval margins of error also change. The most used confidence intervals in the biomedical literature are the 90%, 95%, 99% and not so often 99.9% one. The narrower the margins of an interval are, the higher is the estimate accuracy. The 95% confidence interval is traditionally the most used interval in the literature and this relates to the generally accepted level of statistical significance P < 0.05. There is a rule for same sized samples: the smaller the confidence level is, the higher is the estimate accuracy. Let us now see how the range of confidence interval and its margins of error change depending on the confidence level in our example of cholesterol concentration estimate in the population (Figure 1).
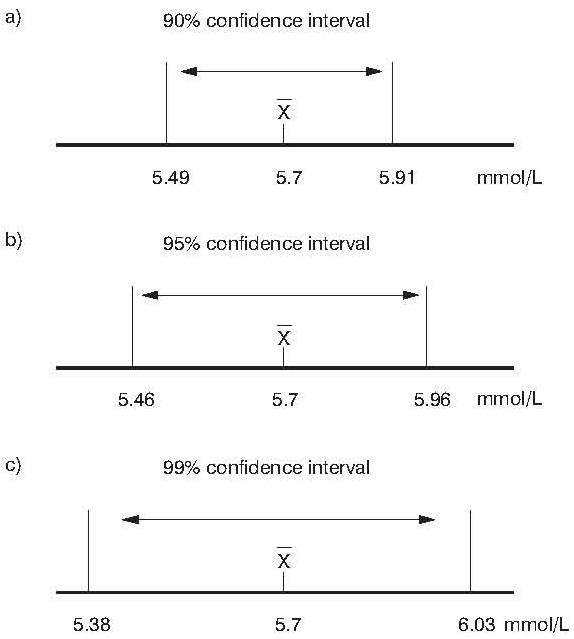
Figure 1. a) 90% confidence interval; b) 95% confidence interval; c) 99% confidence interval of mean cholesterol concentration (N=121)
We can claim with 90% confidence that the cholesterol concentration in the population lies within the interval margins of 5.49–5.91 mmol/L. In other words: if we select randomly hundred times a sample of 121 individuals and calculate the mean cholesterol concentration and the confidence interval of that estimate in the sample, then in ten out of these hundred samples the confidence interval will not include the actual mean of the population. The thing we do not know is – which 10 samples are we talking about? Exactly that is what makes our estimate (un)reliable.
If we decide for the 95% confidence, the interval margins are 5.46–5.96 mmol/L and in five randomly selected samples the mean of population will not be included. The largest range belongs to the 99% confidence (5.38–6.03 mmol/L). The larger the confidence interval is, the higher is the possibility that this interval includes also the mean of cholesterol concentration in the population.
Only the studies with a large sample will give a very narrow confidence interval, which points to high estimate accuracy with a high confidence level.
How to calculate a confidence interval?
A confidence interval can be attributed to almost every statistical measure: to a correlation coefficient (6), to odds ratio (OR) and e.g. to the measures of diagnostic accuracy such as sensitivity, specificity and some others (7). Although there are some other ways of calculating it, the confidence interval is generally and most frequently calculated using standard error. Standard error is a standard deviation of sample means, calculated out of hundred random population samples (8).
First we have to determine the confidence level for estimating the mean of a parameter in a population. In other words, we ask ourselves to what extent we accept a wrong estimate. Most often we decide for the 95% confidence what means that we will allow that only in 5% cases the actual mean of population does not fall into our interval.
Margins of error for a confidence interval are calculated using Z value, standard sample deviation (SD) and sample size (N) according to the formula:

The lower margin of a confidence interval is calculated by deducting the previous formula result from the mean. The upper margin is calculated by adding the formula result to the mean. The definition of a confidence interval is therefore:
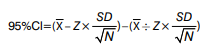
The Z value depends on the chosen confidence level. It should be kept in mind that a confidence interval is accurate only for the samples that follow a normal distribution, whereas it is approximately accurate for large samples that are not distributed normally. For small samples (N < 30) the t value should be used instead of the Z value in the formula for confidence interval, with N-1 degrees of freedom (9). The t value comes from the Student’s t-distribution and depends on the sample size. For small samples the t value is higher than the Z value what logically means that the confidence interval for smaller samples with the same confidence level is larger. Z values for matching 90%, 95%, 99% and 99.9% confidence levels are listed in the Table 1. Many statistical textbooks contain tables with t values for matching confidence level and different degrees of freedom (1).
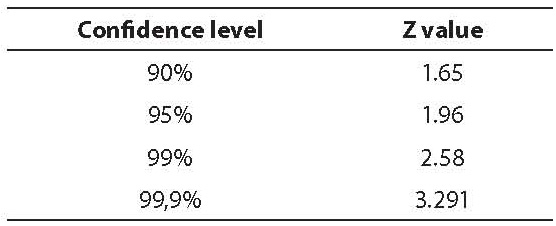
Table 1. Z values for the most frequent confidence levels
In our sample example, with the mean cholesterol concentration in the population, the confidence interval would be calculated by using the Z value because of the large size of the sample (N=121) that is normally distributed.
In our example we would report the mean cholesterol concentration with appropriate 95% confidence interval as 5.7 mmol/L (95% CI = 5.46–5.96).
Due to the fact that today there are a lot of statistical softwares that calculate and provide confidence intervals for the majority of statistical indicators, we shall rarely calculate a confidence interval manually. However, it is important to know the input based on which the confidence interval is calculated, so we could better understand its meaning and interpretation.
Do the P value and the confidence interval have the same meaning?
The P value and the confidence interval are two complementary statistical indicators. They describe the same thing, but in two different ways and are complementary to each other. The P value describes probability that the observed phenomenon (deviation) occurred by chance, whereas the confidence interval provides margins of error within which it is possible to expect the value of that phenomenon.
Confidence interval can be calculated for difference or ratio between any two statistical indicators, so we could examine if this difference or ratio is of any statistical significance. Let us go back to our example of cholesterol concentration in the population to see how the confidence interval can be used for estimating statistical significance of the difference between two means.
The difference in the cholesterol concentration between men and women in our sample is 0.22 mmol/L. Is this difference statistically significant? Do women in our sample have indeed a lower cholesterol concentration then men, or did the observed difference only occur by chance? The answer to this question gives us the Student t-test. The P value calculated by the t-test is 0.426 proving that the difference of the cholesterol concentration between men and women is not statistically significant. The same thing, only in a different way, we can see in 95% confidence interval of difference of mean cholesterol concentration between men and women, which is (-0.322) to (+0.757) (Table 2).
Table 2. Difference in the cholesterol concentration between men and women (N = 121)
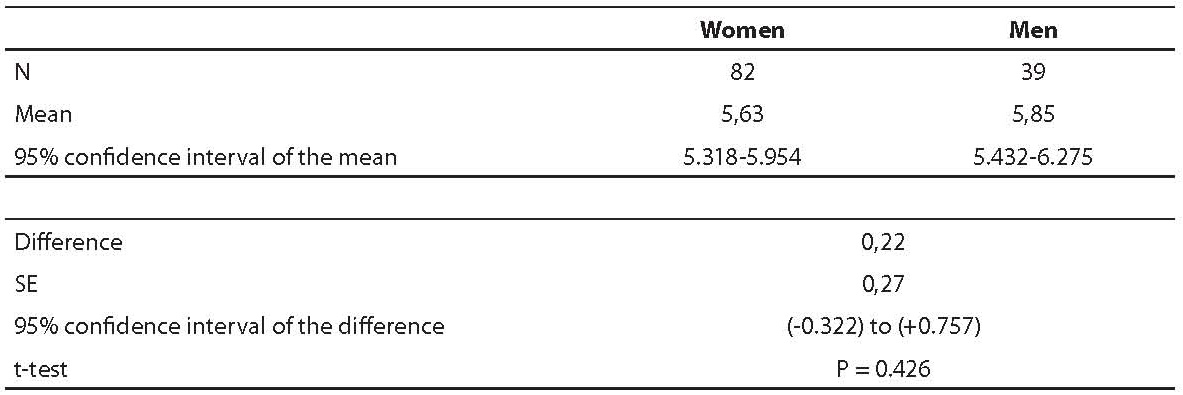
Which conclusion can we draw from that confidence interval? Let us remember what the definition of confidence interval was: it defines margins of error within which we can expect the actual value with 95% confidence. Our confidence interval contains also a zero (0) meaning that it is quite possible that the actual value of the difference will equal zero, namely, that there is no difference between the cholesterol concentration between men and women.
How do we define the confidence interval when it is related to a ratio as, for example, in OR? Let us imagine that we have assessed the degree of carotid artery stenosis for all our individuals from the sample (N = 121) using echo-colour Doppler sonography analysis. We divide them into two groups: the ones with the absence of carotid artery stenosis and the others with stenosis (> 50% lumen) of at least one carotid artery. We are interested whether those two groups are different in average cholesterol concentration and is the cholesterol concentration a risk factor for development of carotid artery stenosis. The answer to this question gives us the OR (Table 3).
Table 3. OR and 95% confidence interval of cholesterol concentration in individuals with/without carotid artery stenosis

OR is higher than 1, but the confidence interval for OR includes the number 1 as well. What does it mean? It means that the odds of cholesterol concentration being and not being a risk factor for carotid artery stenosis are even. That is, for any cholesterol concentration the odds of that person having or not having carotid artery stenosis are the same. This also confirms the percentage of correctly classified individuals considering the cholesterol concentration (50.41%). Only half of the individuals are correctly categorised in an adequate group – so the selection does not depend on cholesterol concentration but on a pure chance.
Conclusion
Confidence interval can be attributed to almost every statistical measure. In the last twenty years, every day there are more journals that require reporting of the confidence intervals for each of their key results. Reporting of this confidence interval provides additional information about the sample and the results. It is, moreover, above all useful and irreplaceable supplement to a classical hypothesis testing and to the generally accepted P value. It should become a standard of all scientific journals to report key results with respective confidence intervals because it enables better understanding of the data to an interested reader.