Introduction
Asymptomatic microhematuria is a common finding in general population. The prevalence varies from 0.19% to 16.1% in adults, depending on the age and sex of the population screened, the length of follow-up, and the number of screening studies per patient, while it amounts up to 21% in elderly men who are at an increased risk of severe urologic diseases (1). Microscopic hematuria may be a sign of a serious underlying disease, as well as of some benign conditions not harmful to the patient (2,3). As tumors of the kidney, urinary bladder or prostate are found in 10%-15% of individuals affected by hematuria, it should be considered as a symptom of serious disease until proven otherwise. Microhematuria could be glomerular or non-glomerular. Glomerular erythrocytes are characterized by a wide range of morphological alterations (dysmorphic erythrocytes) and are smaller than those from the lower urinary tract, which maintain their regular round shape (isomorphic erythrocytes). Once detected, hematuria should be confirmed on one or two occasions during a short period, and its origin should be determined (4-7).
The morphology of erythrocytes in urine has previously been investigated by bright-field microscopy and phase contrast microscopy. Automated methods (urinary flow cytometry and MCV measurement on blood cell analyzers) provide more objective results, but are limited by disturbing signals from other cells and non-cellular elements present in the urine (urinary debris). In order to avoid this interference, we stained the erythrocytes with phycoerythrin-conjugated antibody against glycophorin A (GlyA), a molecule found on the erythrocyte cell membrane. After staining we analyzed morphological characteristics of erythrocytes by flow cytometry in order to differentiate the origin of hematuria.
Materials and methods
Patients and samples
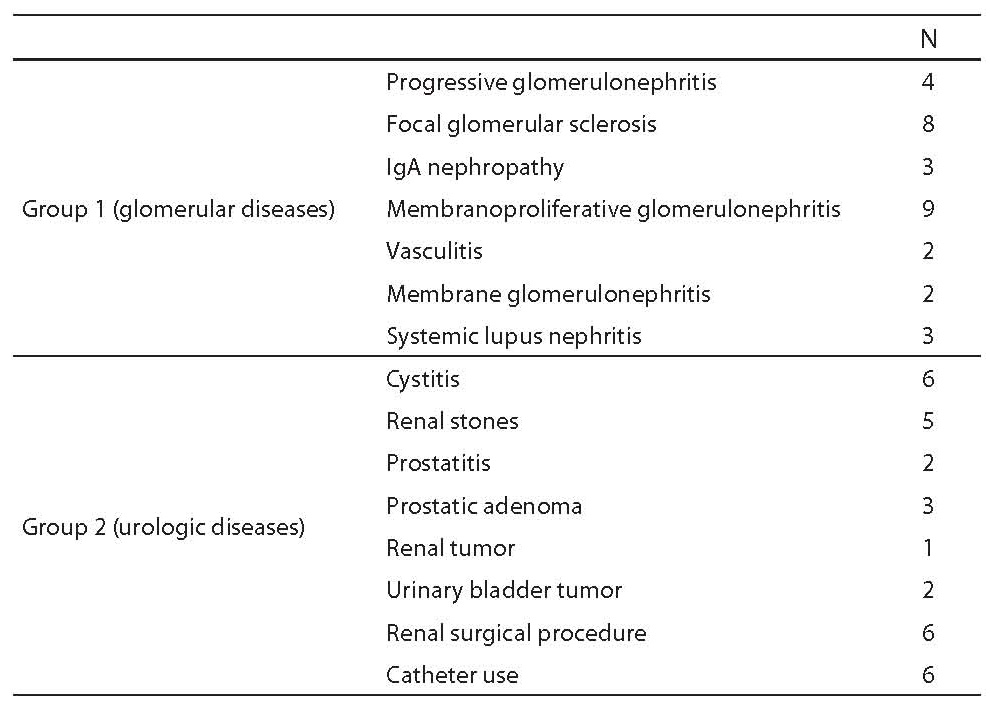
Two groups of patients were investigated in this study. They were admitted either at the Division of Nephrology and Hypertension, University Department of Internal Medicine, or at University Department of Urology, Zagreb University Hospital Center (Table 1). Group 1 comprised 31 patients (20 males and 11 females) with biopsy-proven glomerular disease (intensity of hematuria in urinary sediment: 11 patients with < 5 erythrocytes per high power field (HPF, magnification 400×), 11 patients with 5-15 erythrocytes/HPF and 9 patients with > 15 erythrocytes/HPF). Group 2 consisted of 31 patients (15 males and 16 females) with diagnosed urologic disease (intensity of hematuria in urinary sediment: 8 patients with < 5 erythrocytes/HPF, 11 patients with 5-15 erythrocytes /HPF and 12 patients with > 15 erythrocytes/HPF). Kidney biopsy was not performed in any group 2 patient.
Second morning urine samples were collected from all patients, transported to the laboratory and processed within an hour. In group 1 patients, urine samples were obtained before biopsy.
The study was approved by the Hospital Ethics Committee.
Table 1. Study patients characteristics
Preparation of samples
For analysis, 2x10 mL of each urine sample were centrifuged for 10 minutes at 2500 rpm, the supernatants were decanted and sediments rinsed twice with 5 mL of phosphate buffer pH 7.0. After centrifugation, 10 mL of phycoerythrin-conjugated antibody against glycophorin A (RPE-Conjugated Monoclonal Mouse Anti-Human Glycophorin A, Dako A/S Denmark) (100 mg/L) were added into the first test tube, and 10 mL of phycoerythrin-conjugated murine IgG1 antibody (RPE-Conjugated Mouse IgG1 Negative Control for Flow Cytometry, Dako A/S Denmark) (100 mg/L) to the second test tube for negative control. Both test tubes were incubated for 10 minutes at room temperature, rinsed with 3 mL of phosphate buffer pH 7.0 and centrifuged. Finally, the sediments were resuspended in 500 mL of phosphate buffer pH 7.0.
Instruments and methods
Prepared samples were analyzed on a FACScan flow cytometer using CellquestTM program (Becton Dickinson, San Jose, USA), with argon laser as light source of 488 nm wavelength. Firstly, erythrocytes were selected as fluorescent positive cells on cytogram, in a total of 10,000 cells. Then, two flow cytometric parameters were measured: forward scatter light intensity (FSC) and side scatter light intensity (SSC). Mean FSC and SSC values were automatically calculated by the instrument for each sample. It is generally thought that FSC and SSC are proportional to cell size and polymorphism of nucleus, respectively. We used FSC as a measure of erythrocyte size and SSC as an indicator of cell surface unevenness because erythrocytes had lost their nuclei. Also, the SSC/FSC ratio was calculated to eliminate the influence of cell size on the SSC parameter.
Statistical analysis
Statistical analysis was performed by using GraphPadPrism 5 statistical program (GraphPad Software, Inc., USA) version 5.01. Variables were tested for normality using the Kolmogorov-Smirnov test. Parametric data were expressed as arithmetic mean and standard deviation, whereas nonparametric data were expressed as median and interquartile range. Mann-Whitney test was used for between-group difference testing. Values of P < 0.05 were considered statistically significant. The Receiver Operating Characteristic (ROC) analysis was used to illustrate diagnostic performance of the study method parameters.
Results
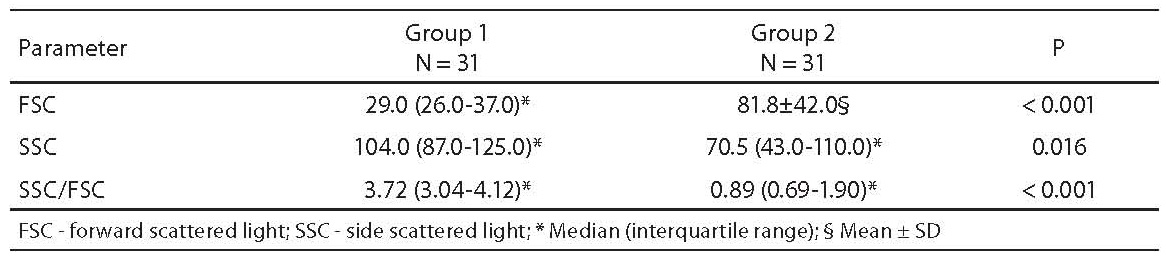
The results obtained for FSC, SSC and SSC/FSC ratio are shown in Table 2. We found a statistically significant difference in all parameters between the two groups of patients.
Table 2. Results of flow cytometric analysis
The results of ROC analysis are shown in Table 3. The areas under the curve (AUC) obtained with the respective 95% confidence intervals as well as optimal cut-off values and diagnostic sensitivities and specificities are presented for all three parameters. A statistically significant difference between the AUC obtained was found for FSC and SSC (P = 0.013), and for SSC/FSC ratio and SSC (P < 0.001). Difference between the AUC obtained for FSC and SSC/FSC ratio was not statistically significant. ROC curves for FSC, SSC and SSC/FSC ratio are shown in Figure 1, with cut-off values for glomerular hematuria.
Table 3. Results of ROC analysis
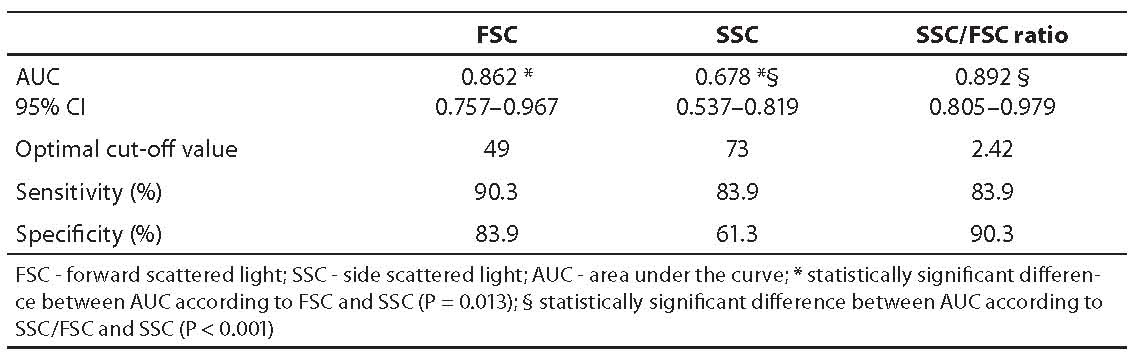
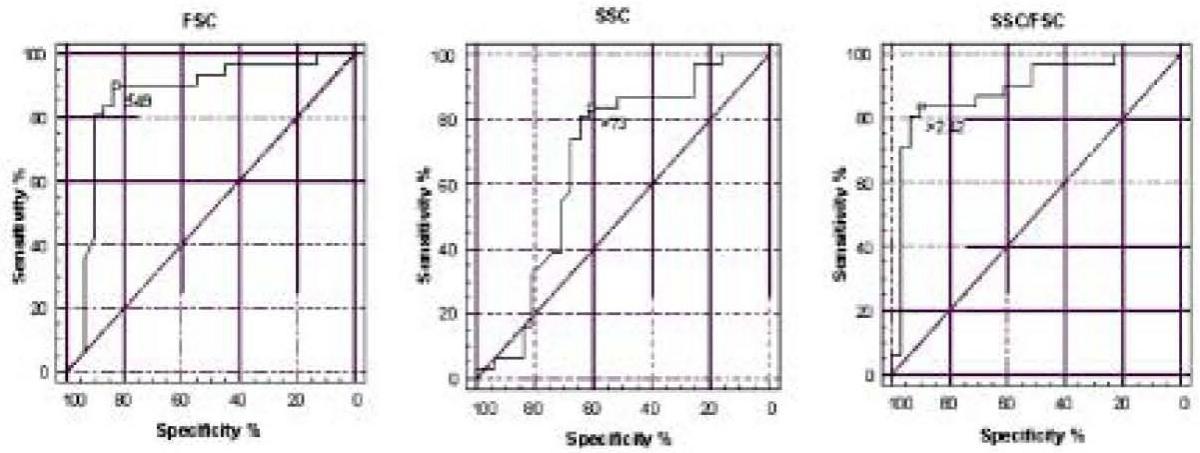
Figure 1. ROC curves for discrimination of the origin of hematuria by flow cytometry method according to FSC, SSC and SSC/FSC ratio.
Typical patterns of flow cytometry urine testing in patients with glomerular and non-glomerular hematuria are shown in Figure 2. The values obtained for patient with glomerular hematuria were as follows: FSC = 31.2; SSC = 110.4; and SSC/FSC = 3.54; and for patient with non-glomerular hematuria FSC = 65.8; SSC = 36.5; and SSC/FSC = 0.54.
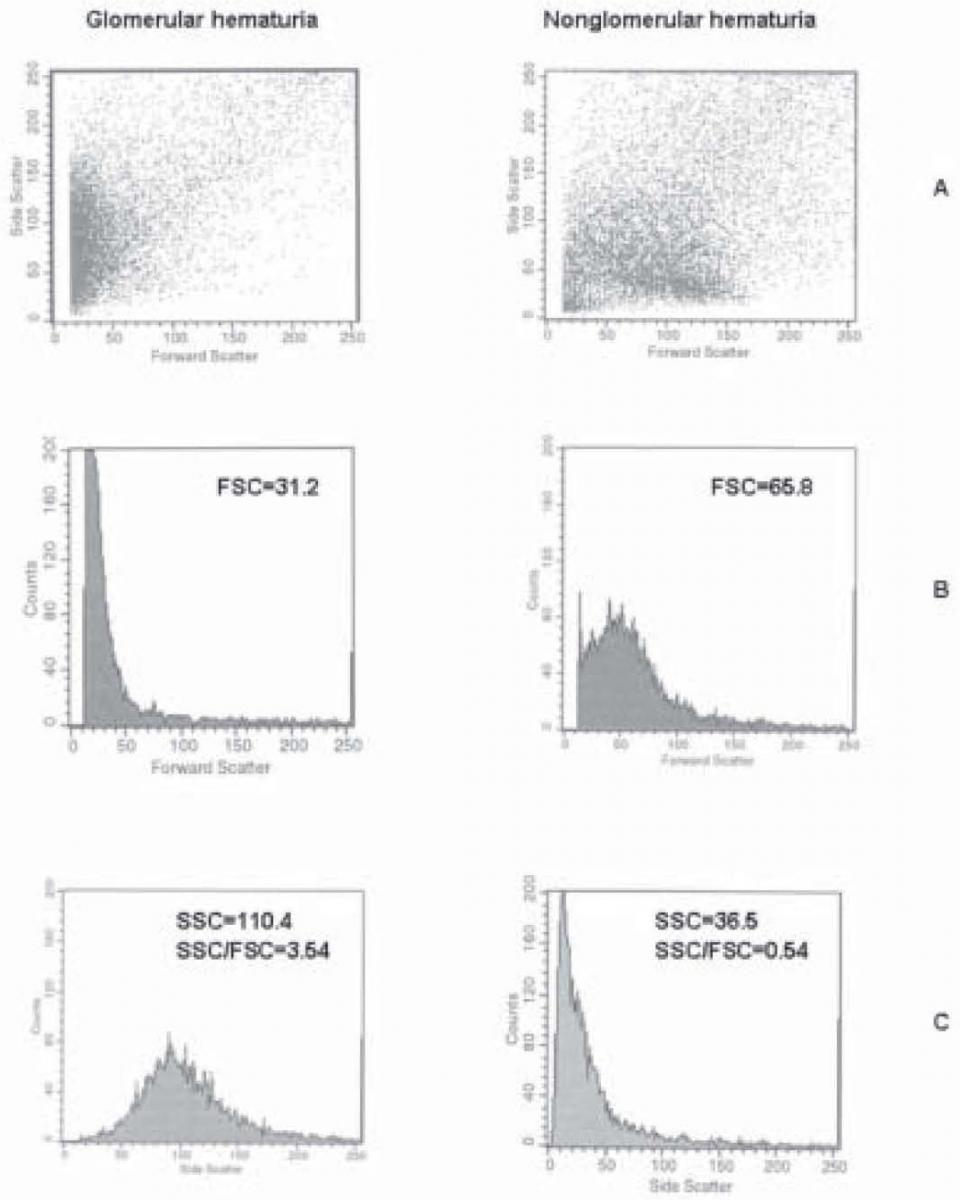
Figure 2. The typical patterns of flow cytometry urin analysis in patients with glomerular and non-glomerular hematuria: FSCxSSC scatterplots (A), distribution of erythrocytes according to FSC (B) and SSC (C).
An example of flow cytometry urine analysis of two samples from the same patient obtained prior and following biopsy is shown in Figure 3. The patient was from group 1, with biopsy proven glomerular kidney disease. The values obtained in the first sample were as follows: FSC = 40.7; SSC = 99.9; and SSC/FSC = 2.45, and in the second sample FSC = 78.2; SSC = 69.4; and SSC/FSC = 0.89.
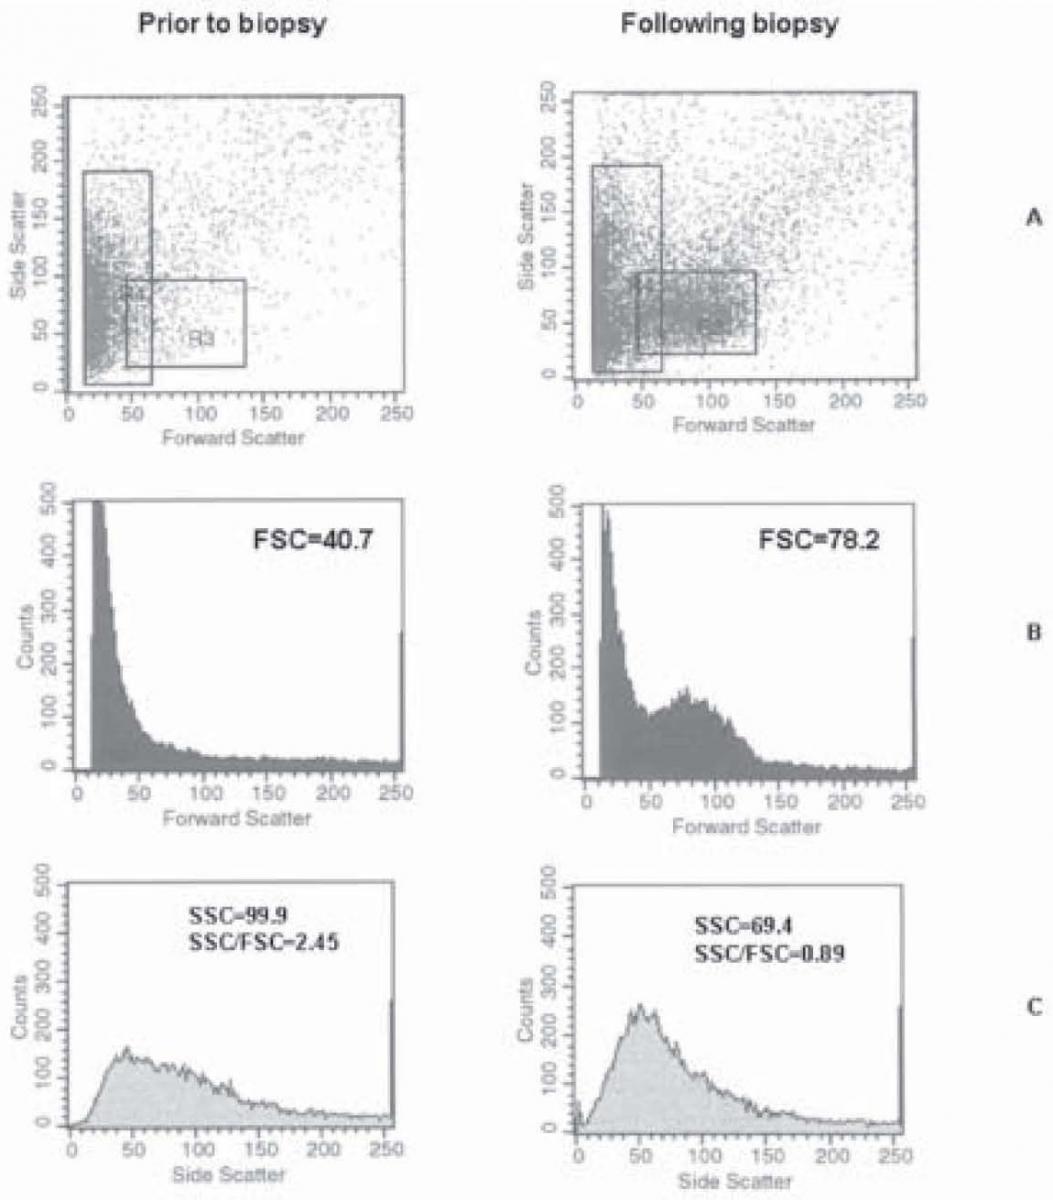
Figure 3. Flow cytometry analysis of two samples from the same patient obtained prior and following kidney biopsy: FSCxSSC scatterplots (A), distribution of erythrocytes according to FSC (B) and SSC (C).
Discussion
Reliable determination of the origin of hematuria is of great clinical importance. Although microscopic techniques are cost-effective, they are time-consuming and associated with inter-observer variations (1,8-15). Although more objective results have been obtained with the introduction of automated methods (urinary flow cytometry and MCV measurement on blood cell analyzers), identification of erythrocytes only by size leads to the interference of urinary debris (16-25).
In the present study, we stained erythrocytes prior to flow cytometry analysis with phycoerythrin-conjugated antibody against Gly A, a glycoprotein on erythrocyte membrane specific for erythroid cell line, and then analyzed morphological characteristics of erythrocytes by measuring FSC and SSC as indicators of erythrocyte size and shape, respectively. Also, the SSC/FSC ratio was calculated. To our knowledge, this method has not been previously reported in the literature. The method of erythrocyte labeling with fluorescein-labeled antihemoglobin antibodies has been reported by Tanaka et al. (26). As it is well known, hemoglobin is a molecule localized inside the cell, and previous cell membrane permeabilization is necessary for erythrocyte labeling. This was not the case with antibodies against Gly A because Gly A is a molecule found on the erythroid cell membrane.
We found statistically significant differences in FSC, SSC and SSC/FSC ratio values between patients with glomerular and urologic source of bleeding (Table 2).
The ROC curve analysis revealed good discrimination between the two groups of patients according to the measured parameters, FSC and SSC/FSC ratio in particular (Table 3, Figure 1). Based on the SSC/FSC ratio, glomerular hematuria was confirmed in 26 of 31 group 1 patients (sensitivity 83.9%), while in 5 patients (16.1% false negative results) non-glomerular hematuria was found. Among these 5 samples, low intensity hematuria was observed in 3 samples (1+ or less by dipstick testing, < 5 erythrocytes/HPF in urine sediment analysis). False positive results of glomerular hematuria were obtained in 3 (9.7%) group 2 patients (specificity 90.3%). Two of them had high urine osmolality values (626 and 951 mOsmol/kg), which was the most likely cause of change in erythrocyte shape and of the false positive result.
As expected, we observed lower FSC and higher SSC values for glomerular hematuria, as compared with non-glomerular hematuria (Figure 2). Also, the SSC/FSC ratios were significantly higher in glomerular hematuria. These results confirmed the characteristics of “glomerular” erythrocytes that are small but of irregular shape, unlike “non-glomerular” erythrocytes which are larger and smooth-shaped. In the FSCxSSC scatterplot (Fig. 2) of a patient with glomerular hematuria (A), a large prominent cell population was evident with relatively low FSC values but with broad distribution of SSC values. In non-glomerular hematuria, howewer, a cell population could be observed whose SSC distribution was not so broad, but FSC values were remarkably increased.
An occurrence of a new cell population following kidney biopsy, as compared to pre-biopsy finding, was observed in patients undergoing this diagnostic procedure (Figure 3A). This new cell population gave rise to a change in FSC, SSC and SSC/FSC values, and could lead tomisinterpretation of the type of hematuria. However, the patient was affected by glomerular disease, and a nonglomerular erythrocyte population occurred in his urine sample due to the invasive diagnostic procedure, presenting as mixed hematuria. Flow cytometry analysis program allows for detection of such cases and also separate analysis and follow-up of two erythrocyte populations in mixed hematuria.
According to our results, the method described that identifies only erythrocyte from urine by staining with phycoerythrin-conjugated antibody against Gly A enables reliable differentiation of the origin of hematuria. It would, nevertheless, be useful to confirm the results obtained in a larger number of subjects, and to examine the method sensitivity for mild hematuria. The limitation of the study was the possibility of concomitant glomerular disease in group 2 patients, which was not excluded by kidney biopsy. Also, as in other methods used to distinguish the origin of hematuria, the analysis should be performed shortly after sampling, particularly of highly concentrated or diluted urinary samples.
The method described seems to be objective, simple and applicable in routine laboratory practice. It provides clinicians with the possibility to rapidly direct patients to nephrologic or urologic examination and thus to avoid expensive or invasive diagnostic procedures performed to detect the cause of hematuria. To laboratory professionals, it is a new opportunity to use flow cytometry in the fields of urology and nephrology.
Acknowledgment
We are very grateful to the late Dr Branka Uzarevic for her contribution to this study, for advice and help regarding flow cytometry.