Introduction
The report of the Institute of Medicine (1) (IOM) has an impact on laboratory medicine in order to reduce errors and blunders for better patient safety. Laboratory test results have a great impact on clinical decisions making processes. This high degree of influence, the quality of laboratory testing and the reporting is of utmost importance to any clinician and clinical chemist. As most of the errors in laboratory medicine occur in the pre- and post-analytical phases, it is very likely that one will forget to focus on the analytical phase as well. With overwhelming dependence on laboratory results reporting and clinicians making decisions solely based on these reports, it becomes essential for laboratory medicine to set very high quality standards, in order to grant both better patient safety and errors reduction. Laboratory medicine is unique in practice, and this is particularly true for clinical chemistry laboratories. Unlike many other medical processes, activities in laboratory medicine are precisely defined and are therefore more controllable than a procedure or treatment in an emergency or clinical department. This overview will deal with analytical interferences and analytical quality issues.
Reference interval
Before we start to go into further details, we will learn how to interpret data and values obtained in the medical laboratory. An example: a value of 140 has only a very limited meaning. One cannot give any statement if this value is high or low or if this value represents a normal or pathological value. In the field of clinical laboratory one has to use a reference interval, which usually is calculated from a reference population of healthy status. Because it is rather difficult to get those intervals, one has to carefully search the literature for it or relay on intervals provided by the diagnostic manufacturers. Very often the clinician has to differentiate between the status “normal” and “pathological”. It is not that easy if values fall in the so-called “grey zone”, where a repeated measurement might deliver a different result then the previous one (Figure 1).
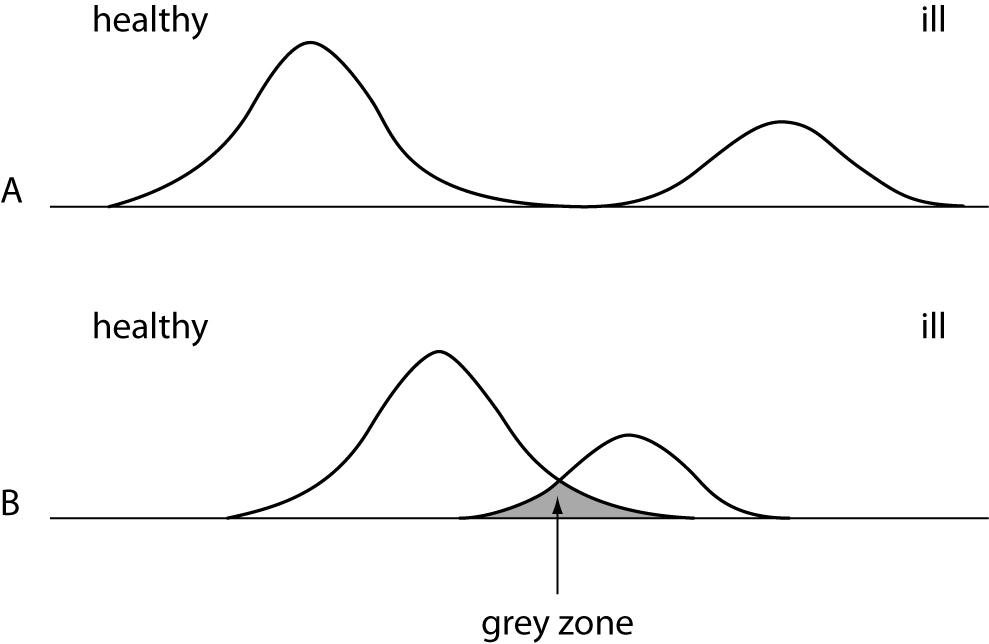
Figure 1. Distribution curves of a population with healthy and diseased persons. A = ideal situation - clearly to discriminate. B = difficult situation - overlapping of both groups.
What is the color of a blood from a black skinned person? Is there a difference? No, there is no difference in the color, but the values for healthy or ill patients with different skin color may become important. Guder et al. have showed the impact of the race on creatine kinase (CK) and amylase activities (2). The CK activity in the black skinned population is about two times higher than in white skinned persons (3). The amylase activity in the Asian population that live in UK is two times higher then in the British population (4).
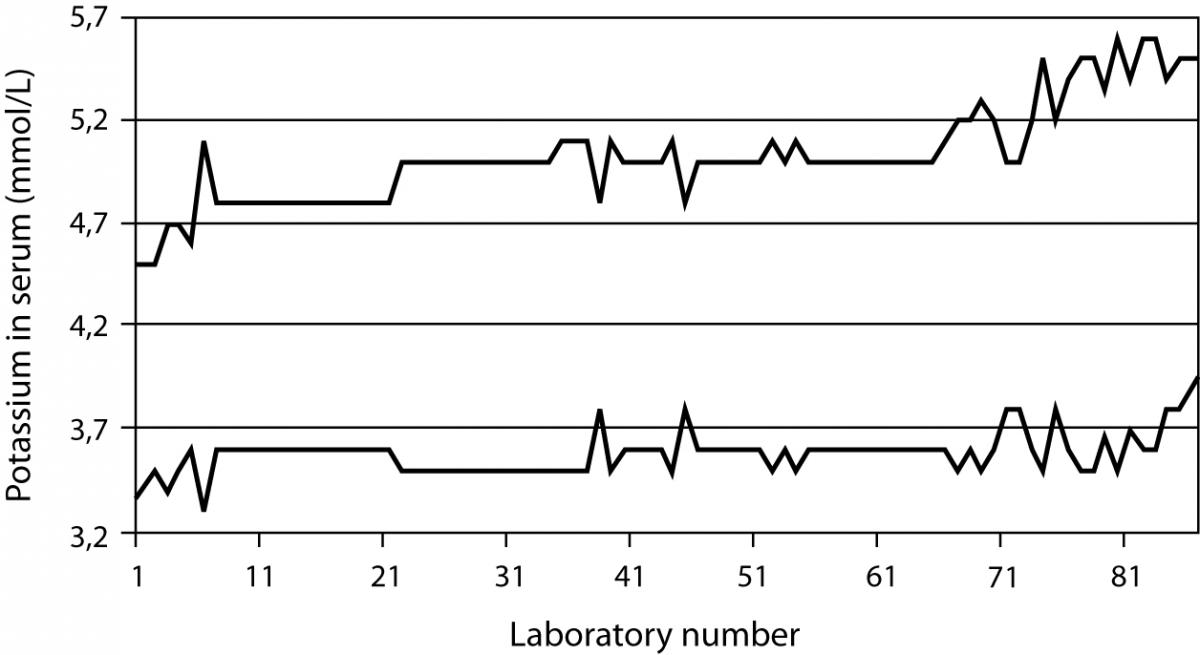
A study undertaken in 101 German laboratories showed clearly the problem of using the correct reference interval (5). As an example concerning potassium, the values for the low end of the interval was found between 3.3 and 3.9 mmol/L, while the range for the high end was found between 4.5 and 5.6 mmol/L (Figure 2). There might be good reasons for the difference, but a questionnaire in this study showed that in most cases the laboratory was not able to explain from which source and literature they have taken the range or since what time they have used the range. Even in modern textbooks one may find references ranges that have been copied from old literature or the author keep it since the first edition of the book.
Figure 2. Results of a survey done in about 101 German laboratories. The top line describes the upper limit and the bottom line the lower limit of the reference interval for potassium. The distance between the lines represents the interval.
The statement of Benson is still valid even if it was published in 1972 (6).
The normal range has had a vague but comforting role in laboratory medicine. It looms on the horizon of our consciousness, perfectly symmetrical like the Mount Fujiyama, somewhat misty in its meaning, yet gratefully revered and acknowledged. Far from being simple and pure, however, like a cherished illusion of childhood, on close examination it proves to be maddeningly complex and is indeed one of the more stubborn and difficult problems limiting the usefulness of clinical laboratory data.
Volume displacement effect
Even modern analytical systems are unable to detect errors created by the patient sample. Frier et al. (7) gave a detailed report on the patient outcome of laboratory error and the resulting wrong clinical treatment due to the quality of the sample.
A six years old boy suffering from diabetes mellitus was delivered to the hospital. One of the laboratory findings was a sodium concentration of 86 mmol/L. The clinicians reacted by treating the boy with physiological saline solution over a time period of seven hours. After that time another sodium measurement was requested and resulted in a concentration of 116 mmol/L. Now, both the clinicians and the laboratory recognized that this could not be clinically correct. They found the sample to be very lipaemic and decided to remove the lipids. The correct sodium concentration was thus found to be 222 mmol/L. As a result of the wrong treatment followed after the erroneous laboratory value for sodium, the child died from intracranial hemorrhage.
We learned that the serum or plasma sample existed out of 93% water and 7% lipids and proteins (8) in healthy population. If there is a disease that changes the concentration of proteins (e.g., myeloma) or lipids (e.g., lipid disorder), one has to consider an effect (i.e., bias) on laboratory tests (9) due to a volume displacement effect. When performing a measurement in the water phase of the sample, it should be recognized that pipetting errors occur due to the displacement effect of the fats or proteins in the sample. The higher the concentration of lipids (especially triglycerides) or proteins, the lower the water part in the sample. A direct measurement with ion selective electrode without a prior dilution of the sample will help avoiding erroneous low sodium values in case of patient with either lipid disorder or from oncology department. Most analyzers do not have this direct measurement technology, and therefore the instrument performs a dilution step prior to measurement and creating an error for low results. If the laboratory has no equipment that is measuring correct values, a written warning remark on the lab report should be provided to clinicians when the patient result is negatively biased due to high lipid or protein concentrations.
Paraproteins
Paraproteins have been reported to interfere with a number of routine clinical chemistry methods for measurement of total and direct bilirubin, high density lipoprotein (HDL) cholesterol, creatinine, C-reactive protein (CRP), glucose, gamma-glutamyltransferase (GGT), iron, inorganic phosphate and uric acid (10). The frequency of paraprotein interference was reported to be very rare. Even so, some systematic studies on total bilirubin, direct bilirubin and HDL-cholesterol showed the reverse. It should be kept in mind that when an interference occurs with one assay, it will not necessary bias another method measuring the same analyte (10). Some technologies like the MicroSlide technology has minimal, or is free of interference, because the sample has to pass special layers that creates an ultrafiltrate. The interfering substance is filtered out in this way of sample treatment (11,12).
Quality control and matrix effect
For quality control procedures in the analytical phase, the laboratory very often, if not always, uses quality control material that should mimic a patient sample. Most quality control materials are made from artificial sources, rather different from human samples. First, the material is filtered, lyophilized, stabilized and very often analytes from animals or synthetic origin is added. A lack of commutability between methods and instruments is known in the field of quality control for a wide range of analytes. An example from a PT survey from the DGKL (German Society for Clinical Chemistry and Laboratory Medicine) is shown in figure 3. Two proficiency testing samples A and B with different concentrations of cholesterol were sent out to several laboratories. A small group of laboratories failed due to the problem of matrix effects in the external quality control material while the internal quality control material did not show the same effect. Additional testing of this method in question compared to a reference method provided a nice correlation if native patient material was used.
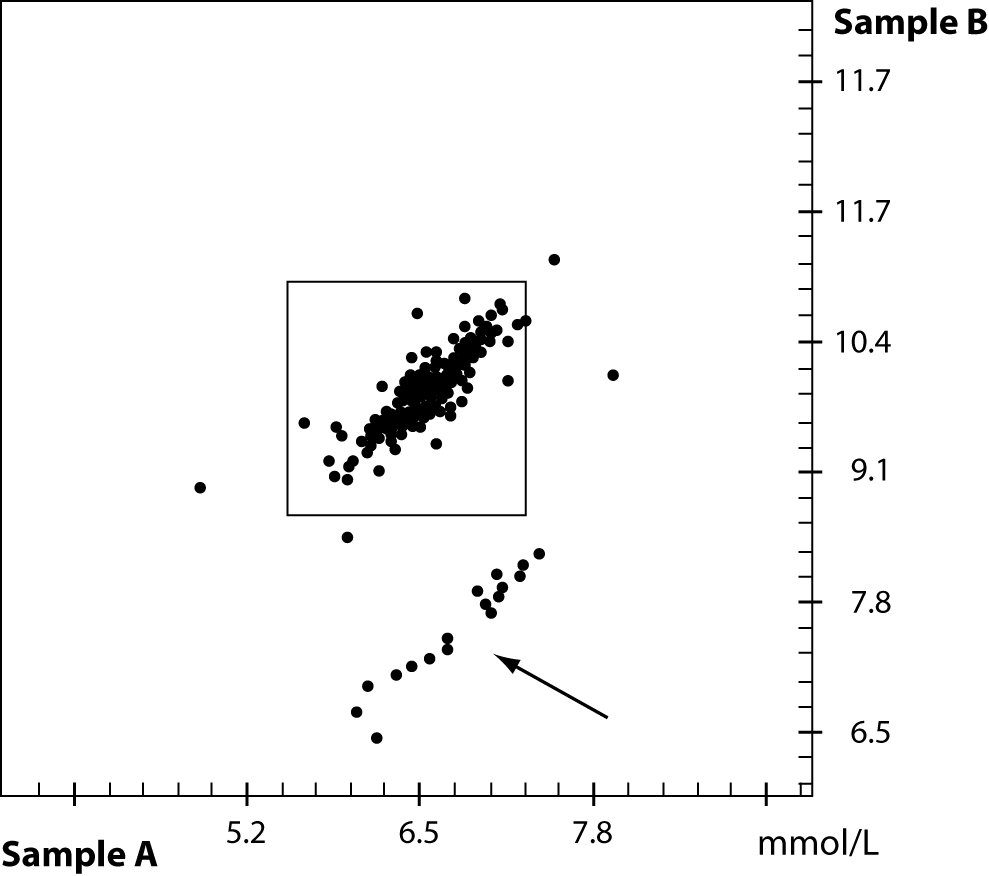
Figure 3. Proficiency testing result of two samples with different cholesterol concentration. Due to matrix effect of the quality control material a group of participants failed – see arrow.
Calibration
The calibration is the first and foremost step in the analytical process of the method or instrument prior to the measurement of quality control material or patient samples. Very often the operator is unable to handle a pipette in the correct way and might therefore dissolve the lyophilized calibrator material with the wrong amount of solvent. As such, it is pivotal to follow strictly the recommendations of the manufacturer. The multipoint calibrator is usually much better compared to a single or two point calibration. Very often the method is calibrated with calibrators that have different analytes then those measured afterwards. An example is the use of albumin in a calibrator to calibrate the total protein assay.
In 2004 the Clinical Laboratory Standards Institute (CLSI) reported the impact of measurement uncertainties (13) that greatly increase the costs in healthcare. A study on calibration of calcium methods was used to describe the costs of errors in calcium concentration when the calibration wasn’t done properly. A sum of annually additional costs of $ 60–199 million was calculated when the calibration was not done correctly.
Drug (analytical) interferences
Any effect on the analytical phase that is created from a substance that is not the analyte to be determined may considered as an analytical interference. The total number of published and therefore known drug interferences is rather high. The knowledge of laboratory staff and clinicians that drugs may cause falsely elevated, falsely normal and falsely lower values in clinical patient material is very often overlooked or unknown. Reports on the interference of metabolites, resulting from the conversion of the mother drug into its metabolites is extremely rare. Studies on the effect of several drugs and their resulting metabolites in patients receiving two, three or even more drugs at the same time are also available in single reports, only. In most cases, it is the manufacturer of the reagents who takes care of the drug interferences. There is no real reporting system available that collects the data about interferences from drugs and their metabolites. In 2006, Young and Tryding created a common database that combines effects of diseases on analytes, impact of herbs to clinical diagnostic tests, analytical interferences, biological effects as well as pre-analytical issues. This database is the largest collection of data on those problems. Due to some reasons, the database is no longer available, though there are some books focusing the interference and effects of drugs (14,15).
Only clinical chemists, the diagnostic industry and medical technicians are the users of the information database so far. It is however important that experts in clinical settings, as well as the pharmaceutical area, are informed about this information and tool. One of the first users of a combination of lab results and drug prescription was published by Friedman et al. (16). In general, they found a positive response of the clinicians for the automatic monitoring of drug-test interferences or interactions. The system had both an educational and clinical value. A new approach was undertaken by Kailajärviet al. (17) in 2000, who combined the information they got form the hospital pharmacy with lab requests and lab results. In their model a database with online support in drug effects on hormone test results was chosen. In 11% of the results they were able to give a warning reminder. In 74% of all cases additional testing or examinations of the patient have been avoided. This study is also a good example to reduce costs in healthcare and provide more reliable test results for a better treatment of the patient. In the future, more focus should be paid by designer drugs on herbs and also genetic modified food that may have an impact to laboratory test results.
Labeling of specimen
Phlebotomists, doctors and nurses need an education regarding the appropriate procedure for blood collection, as well as how to label the specimen. Any person who draws a patient sample must label the tube at the patient´s bedside without taking the tube into a different place. Whenever possible, an automatic labeling is helpful to avoid any identification error. Handwritten labels should be avoided as they create misreading. There are new identification tools like Radio Frequency Identification (RFID) available that help preventing mislabeling. The same is true in the analytical process if samples are taken from the primary tube and transferred into a secondary tube. For modern automated systems and lab automation, the clear identification is a must. Devices, like the RFID is one solution to avoid misreading.
Statistical analysis
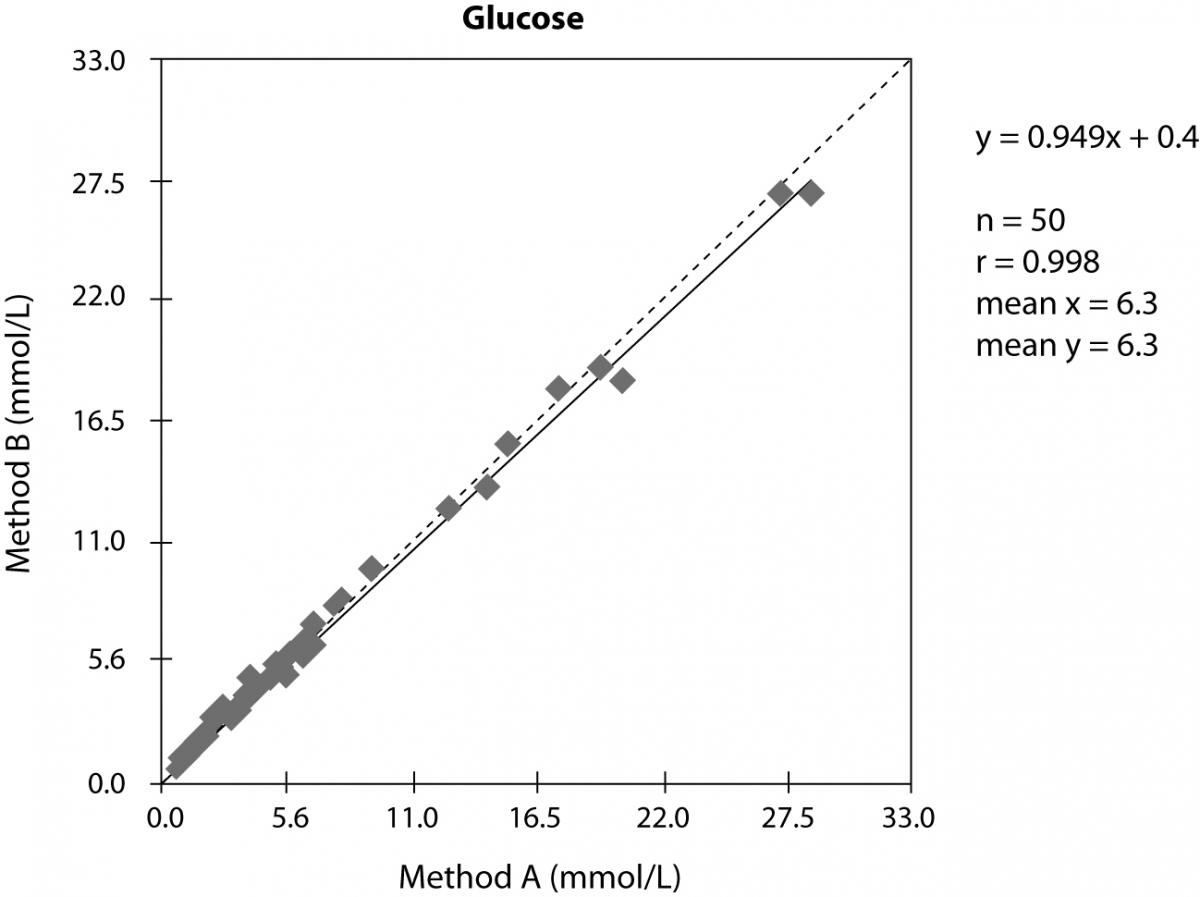
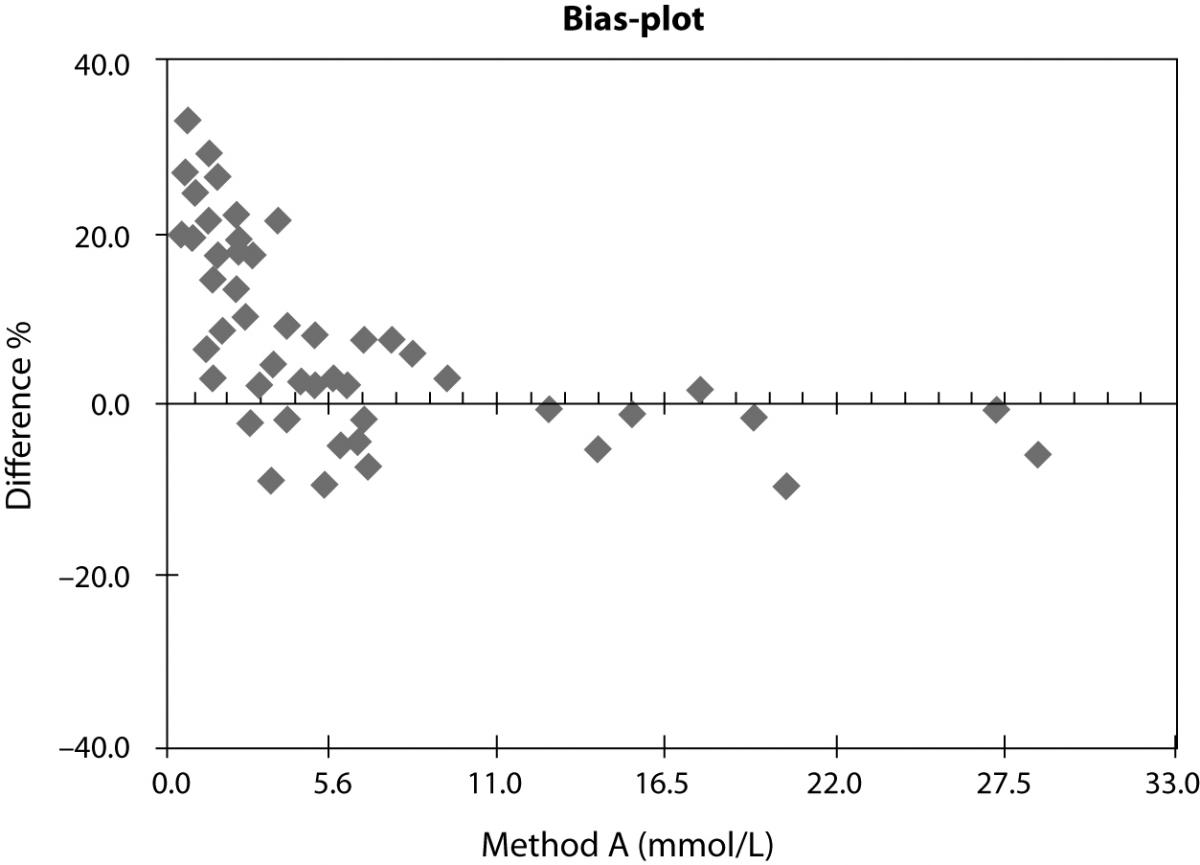
In evaluation studies of methods, one usually compares the new method or new instrument versus the old one. The result of the method comparison is usually presented in x-y-plot and the statistical analysis is performed according the requirements of the scientific journal in which the study should be published. In the example shown in figure 4 we can see a nice correlation and good statistical data. If we do an additional relative bias-plot, we will receive much more details as shown in figure 5. In this example it seems a bit strange that the study involved mainly samples with low glucose concentration. We cannot see any normal distribution of the investigated glucose concentrations and in the relative bias-plot we observe a strong positive bias of the method B. Instead of deliver only the x-y-plot additional information is required to better understand the correlation we did.
Figure 4. x-y-plot of two different methods to measure glucose concentration in serum.
Figure 5. Relative bias-plot of the samo correlation shown in figure 4
Method evaluation
When the laboratory considers buying a new instrument or using a new method, it is supposed to run an evaluation study first. Precision data were usually obtained by running either patient or quality control material. Sometimes the lab might perform a linearity study to confirm the manufactures data. In comparison studies of manufactures it is used very often the same technology or data are compared with those of former instruments by the same company and, inherently, the correlation is fine. Much more interesting is however comparison with other technologies, to better detect any interference or difference. This may help to detect errors or at least start collaboration between the laboratory and the diagnostic industry to find the reasons for any deviation.
Reliability
An article about reliability of scientific published data was published in the journal Nature, in 2005 (18). A questionnaire was sent to 7,760 scientists and they were asked about their behavior in their scientific work and publications. The questionnaire was anonymous and 3,247 scientists answered it. Over 30% of the participants confessed a manipulation of their data. About 15.5% of these participants changed or modified the study design, the method or the results due to intervention of financial support in the study. More than 12.5% ignored questionable interpretations or incorrect results from colleagues. Because their result did not fit into the intended outcome of the study, 6% hold their results back and did not use or publish them.
Conclusion
The ongoing efforts to reduce medical errors and enhance patient safety can be directed toward many health care processes. Clinical diagnostic laboratories recognized risk areas with high potential for error generation. It is prudent that maximum efforts are directed toward preventing errors in areas of high preventability. The human factors involved in generating errors in these specialties deserve priority, and appropriate technology may play a vital role in minimizing many of these factors. The regulatory and legislative bodies have a central role in addressing many of these patient safety issues. The examples given in this paper will help to better understand the source of errors and offers valuable options and opportunities to prevent them. The knowledge of the reasons for deviations and errors will result in lower risks for the patient safety. Even if the analytical process has a small impact on the total number of errors in laboratory medicine, analytical errors should be minimized as much as possible. A new database for drug interferences, effects of herbs and any pre-analytical errors will help to avoid misleading results. Additional statistical analysis and the proper way of showing the differences in method comparison will help for better interpretation of data and avoiding wrong reporting of patient results. Increase in knowledge of the calibration process saves additional money for extra testing or wrong treatment of the patient. The quality control process in the clinical laboratory helps avoiding errors but the correct material has to be selected to improve a better commutability. Finally the reference interval for the population the laboratory has to be updated and correct if needed. Otherwise the reference interval is of limited value for the clinician.
Notes
Potential conflict of interest
None declared.
References
1. Institute of Medicine, Crossing the quality chasm: a new health system for the 21st century. Washington: National Academy Press; 2001.
2. Guder WG, Narayanan S, Wisser H, Zawta B. Samples: From the Patient to the Laboratory. 3rd rev. ed. Weinheim: Wiley-VCH; 2003. p. 6-7.
3. Harris EK, Wong ET, Shaw St jr. Statistical criteria for separate reference intervals: race and gender groups in creatine kinase. Clin Chem 1991;37:1580-2.
4. Tsianos EB, Jalali MT, Gowenlock AH, Braganza JM. Ethic “hyperamylasaemia”: clarification by isoamylase analysis. Clin Chim Acta 1982;124:13-21.
5. Sonntag O. Is this normal? – This is normal! Implication and interpretation of the so-called normal value. J Lab Med 2003;27:302-10.
6. Benson ES. The concept of normal range. Hum Pathol 1972; 3:152-5.
7. Frier BM, Steer CR, Baird JD, Bloomfield S. Misleading plasma electrolytes in diabetic children with severe hyperlipidaemia. Arch Dis Childh 1980;55:771-5.
8. Waugh WH. Utility of expressing serum sodium per unit of water in assessing hyponatremia. Metab 1969;18:706-12.
9. Lyon AW, Baskin LB. Pseudohyponatremia in a myeloma patient: direct electrode potentiometry is a method worth its salt. Lab med 2003;34:357-60.
10. Yang Y, Howanitz PJ, Howanitz JH, Gorfajn H, Wong K. Paraproteins are a common cause of interferences with automated chemistry methods. Arch Pathol Lab Med 2008; 132:217-23.
11. Zaman Z, Sneyers L, van Orshoven A, Blanckaert N, Marien G. Elimination of paraprotein interference in determination of plasma inorganic phosphate by ammonium molybdate method. Clin Chem 1995;41:609-14.
12. Sonntag O. Dry chemistry, 1993, Elsevier, Amsterdam-London-New York-Tokyo.
13. NIST. The impact of calibration error in medical decision making. NIST report 04-1. 2004.
14. Tryding N, Tufvesson C, Sonntag O. Drug effects in clinical chemistry. 1996; 7th ed, vol. 1 + 2, Apoteksbolaget AB, Stockholm, Sweden.
15. Young DS. Effects of drugs on clinical laboratory tests. 2000, 5th ed, vol 1 + 2, AACC press, Washington, USA.
16. Friedman RB, Young DS, Beatty ES. Automated monitoring of drug-test interactions. Clin Pharm Ther 1978;24:16-21.
17. Kailajärvi M, Takala T, Grönroos P, Tryding N, Viikari J, Irjala K, Forsström J. Reminders of drug effects on laboratory test results. Clin Chem 2000;46:1395-400.
18. Martinson BC, Anderson MS, de Vries R. Scientists behaving badly. Nature 2005;435:737-8.

