Introduction
Antiepileptic drugs are characterized with important inter-and/or intra-individual variation in pharmacokinetics and different susceptibility to adverse reaction (1). The clinical effect of many antiepileptic drugs correlates better with blood levels than with doses (2, 3).
Up until approximately 20 years ago, anti-epileptic therapeutics were restricted to very few drugs that were developed in the first half of the 20th century, so called old antiepileptic drugs. A relatively small therapeutic index and the desirability to guide the therapy with therapeutic drug monitoring (TDM) characterize the antiepileptics of the old, but also of the newer generation (4,5).
The old antiepileptic drugs (AED) still remain valuable in the epilepsy treatment, and the optimization of therapy with these drugs through TDM is imperative.
Carbamazepine (CBZ) is considered the first-line anticonvulsant for the treatment of generalized tonic-clonic and complex partial seizures. Its use is complicated by variable absorption, auto-induction, hetero-induction of the CYP3A4 isoenzyme and its active metabolite carbamazepine-10,11-epoxide (EPO-CBZ) (6). The pharmacologic activity of the metabolite CBZ-E is similar to that of CBZ (7).
PHT is a primary anticonvulsant drug for the prophylaxis and treatment of generalized tonic-clonic and partial seizures. PHT exhibits nonlinear pharmacokinetics in the therapeutic range. All these properties of antiepileptic drugs argue the use of TDM (8,9), as the interpretation of plasma levels of AED in the light of the clinical situation of epileptic patients can markedly influence dose optimisation of these drugs (10).
Selecting the most appropriate analytical methods is often not easy and the choice depends on the availability of staff, expertise and equipment, the nature of the service to be provided and the range of drugs to be assayed.
The major advantage of chromatographic techniques is their flexibility and adaptability to a wide range of drugs. However, in comparison to immunoassays they are slow, labour-intensive techniques which usually demand a high degree of technical expertise. Immunoassays have higher development cots than chromatography, narrow range of drugs to be analysed and are generally more susceptible to interference to endogenous components (cross-reactivity) (11).
The objective of our study was to investigate the interchangeability of immunoassay and chromatography for the quantitative measurement of CBZ and PHT and to investigate whether measurements in two labs using different HPLC systems could results in differences in the determination of CBZ and PHT in same serum samples. Additionally we investigated the relation between the serum concentrations of CBZ and its metabolite, CBZ-E.
Materials and methods
This retrospective study was carried out on 102 blood samples collected from epileptic outpatients who were referred for routine TDM in the IMD lab-Berlin (Institute for Medical Diagnosis, Berlin, Germany). Serum concentrations of CBZ were determined in 72 samples, while the concentrations of PHT were determined in 30 serum samples. Blood samples were taken at steady state concentration of these drugs. The serum concentrations of CBZ and its metabolite CBZ-E and PHT were determined comparatively by two HPLC systems, HPLC 1 and HPLC 2 (HPLC 1: model Shimadzu LC-9A in the Institute of Clinical Pharmacology of University Clinical Center “Charite”, Berlin; HPLC 2: model Agilent 1050 HPLC-System in the Institute for Medical Diagnosis-IMD Berlin). In both institutions measurements of AED are established for routine TDM.
In the HPLC 1 we used the commercial available kit for determination of AED (ChromsystemsInstruments & Chemicals GmbH, München, Germany). We used other components of kit: Mobile Phase, high resolution, 1000 mL; AED Serum calibration standard; Internal standard, 15 mL and Precipitation reagent, 5 mL. We performed a sample preparation as was described in the manual of manufacturer. The HPLC 1 parameters were:
- isocratic HPLC system with UV detector;
- injection volume 20 µL;
- flow rate: high resolution, 1.2 mL/min;
- wavelength: 204 nm;
- column temperature ambient (~25 °C).
We have used a column and precolumn of ChromsystemsInstruments & Chemicals GmbH.
In the HPLC 2 we used a ClinRep® Complete Kit for AED in serum (order no. 15000; RECIPE Chemicals + Instruments GmbH,München, Germany). The Kit components of ClinRep® were: Mobile phase 1000 mL; Standard solution 3 mL; P Precipitant with internal standard IS 15 mL; Serum calibrator, lyophylisate 3 mL; Sample preparation vials with reagent (lyophilisate) and D diluting solution. The procedure of sample preparation was described in the manual of ClinRep® Complete Kit.
The HPLC 2 parameters were:
- isocratic pump, flow rate 1.0 mL/min;
- 10 µL injection volume;
- injection interval 15 min;
- UV/VIS Detector 205 nm;
- HPLC-thermostat 55°C.
The concentration of CBZ and PHT of the same patient’s samples were determined consecutively by bench top immunoassay analyzer (Model MGC 240 Microgenics – Fisher Scientific, Passau, Germany). We used a Carbamazepine kit (CEDIA) and Phenytoine kit (CEDIA) and Biorad controls (Immunoassay Plus Control – Lyphocheck level 1, and Lyphocheck level 2). The calibration stability (Cedia® Core TDM Multi calibrator) was controlled by daily running of controls to check the intra assay specifity. Between run coefficients of variation were < 8% for all assays in two HPLC analytical systems. Serum samples were stored at -20 °C. The statistical analysis of relations between HPLC and immunoassay results was performed with Microsoft EXCEL® software (Analyse-it®), using the linear regression analysis and Passing-Bablok method and Bland-Altman plots (12).
For presentation of relation between the CBZ and CBZ-E we used parametric tests when the data had a Gaussian distribution (Student-t test and Pearson correlation coefficient) (13).
Results
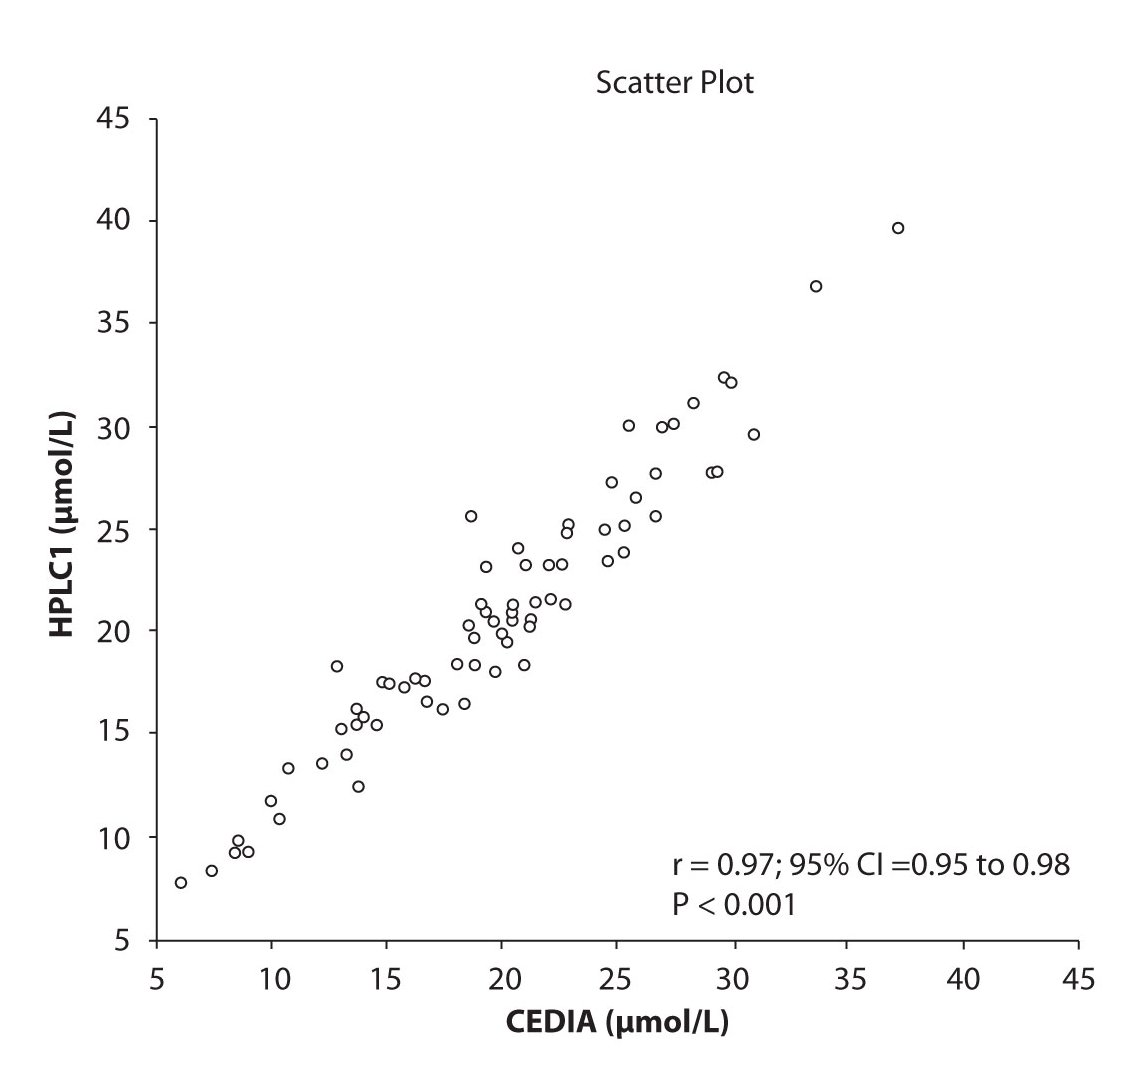
Analysis of the results revealed that the compliance of serum concentrations of CBZ and PHT between immunoassay and HPLC and between two different HPLC (HPLC 1 and 2) is very good. We observed excellent correlation (r = 0.97, P < 0.001) between CBZ concentrations obtained by HPLC 1 and CEDIA (Figure 1a). The same correlation (r = 0.97, P < 0.001) of CBZ concentrations were found between HPLC 2 and CEDIA (Figure 1b). In the analysis of compliance between the two HPLC systems in determination of CBZ concentrations, we obtained even better correlation, r = 0.99, P < 0.001 (Figure 1c).
Figure 1a. The comparison of serum concentration of CBZ between CEDIA immunoassay and HPLC 1
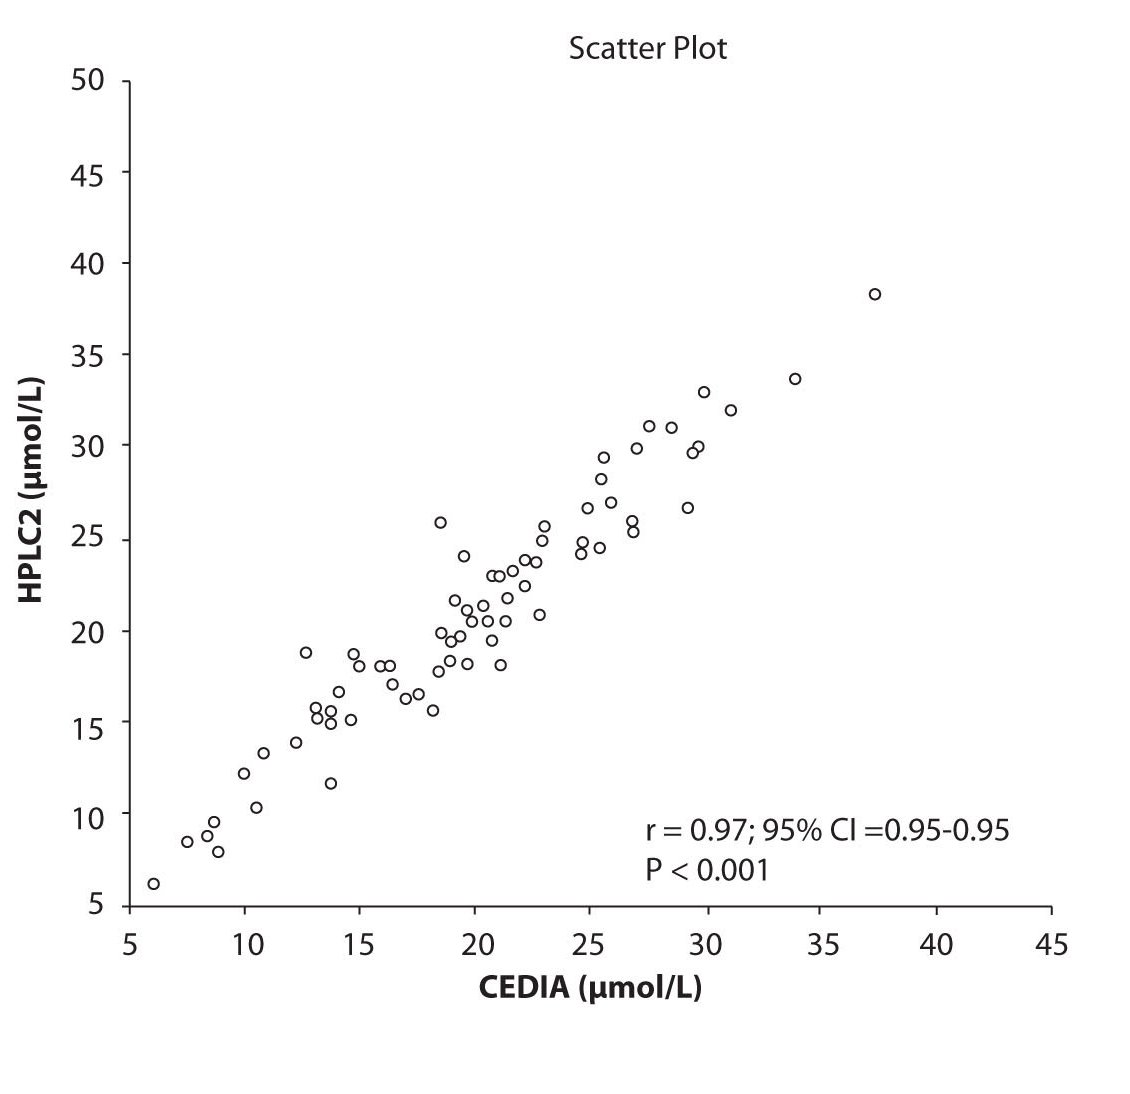
Figure 1b. The comparison of serum concentration of CBZ between CEDIA immunoassay and HPLC 2
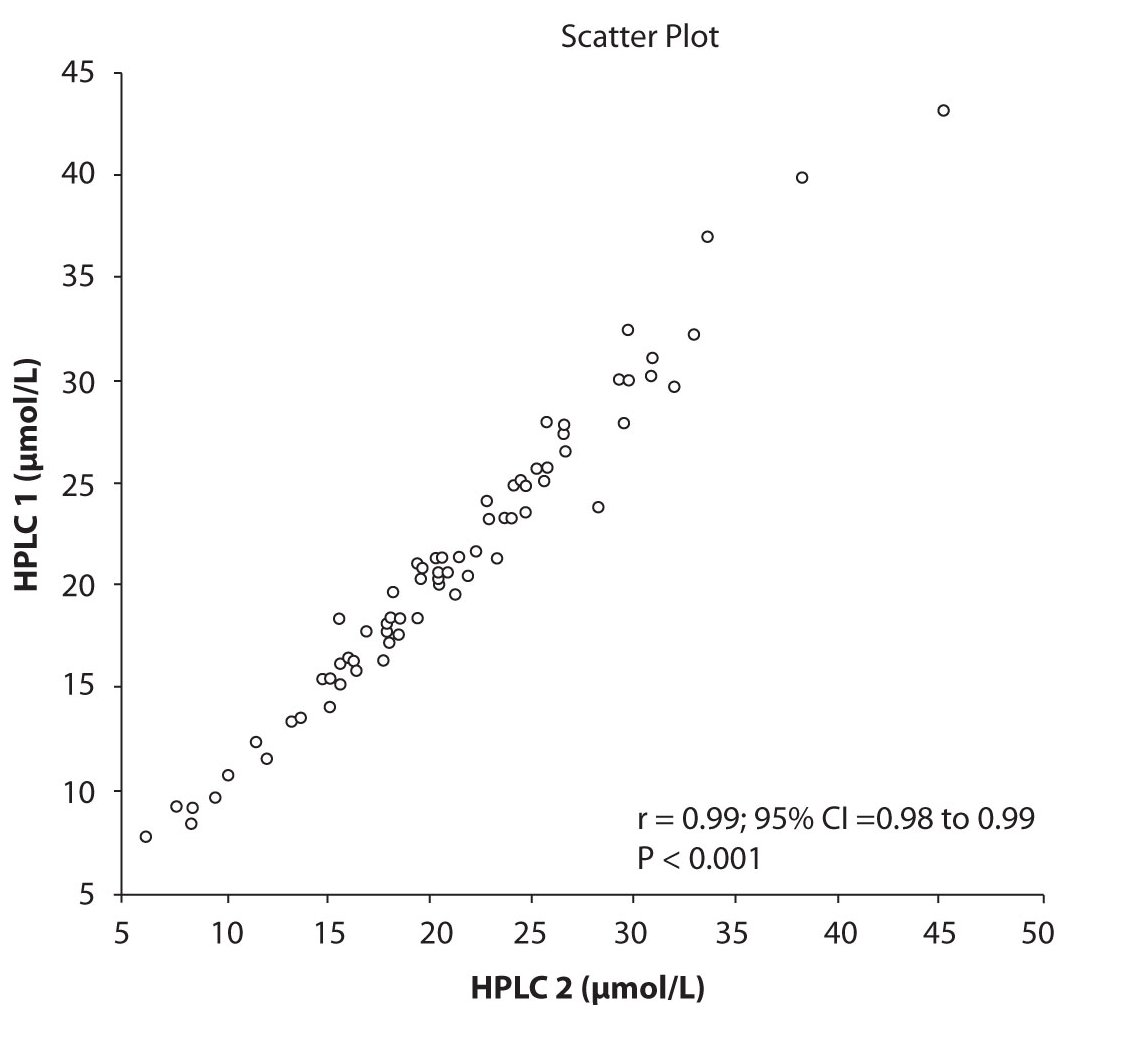
Figure 1c. The comparison of serum concentration of CBZ between HPLC 1and HPLC 2
Likewise correlations were obtained for PHT serum concentration for different analytical methods. The good correlation of PHT serum concentration between HPLC 1 and CEDIA (r= 0.98, P < 0.001) and between HPLC 2 and CEDIA (r= 0.98, P < 0.001) is presented in figure 2a and 2b, respectively. Comparison of PHT serum concentrations obtained by two different HPLC (HPLC 1 and 2) in two different labs also showed very good correlation (r = 0.98, P < 0.001) (Figure 2c).
Figure 2a. The comparison of serum concentration of PHT between CEDIA immunoassay and HPLC 1
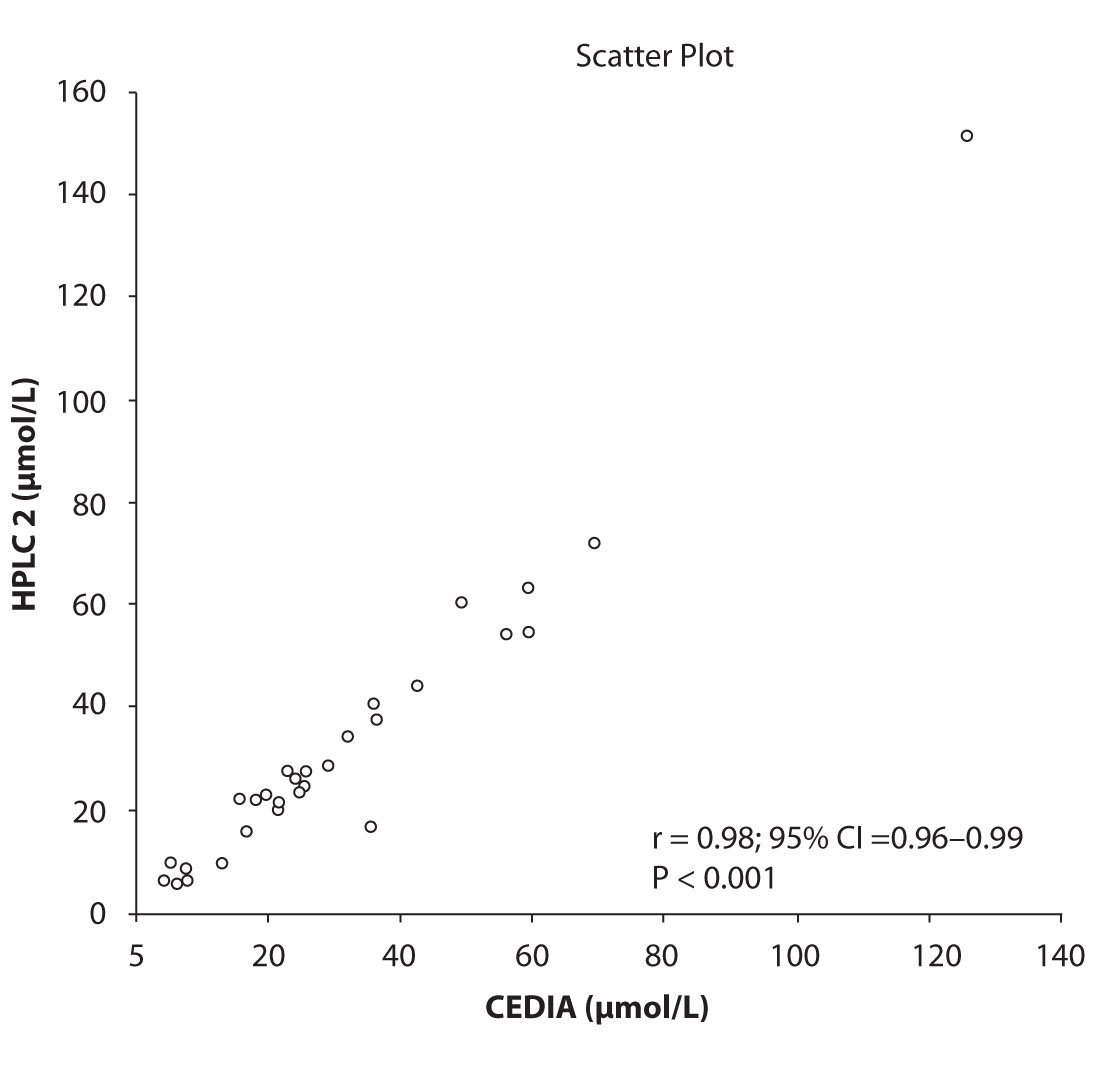
Figure 2b. The comparison of serum concentration of PHT between CEDIA immunoassay and HPLC 2
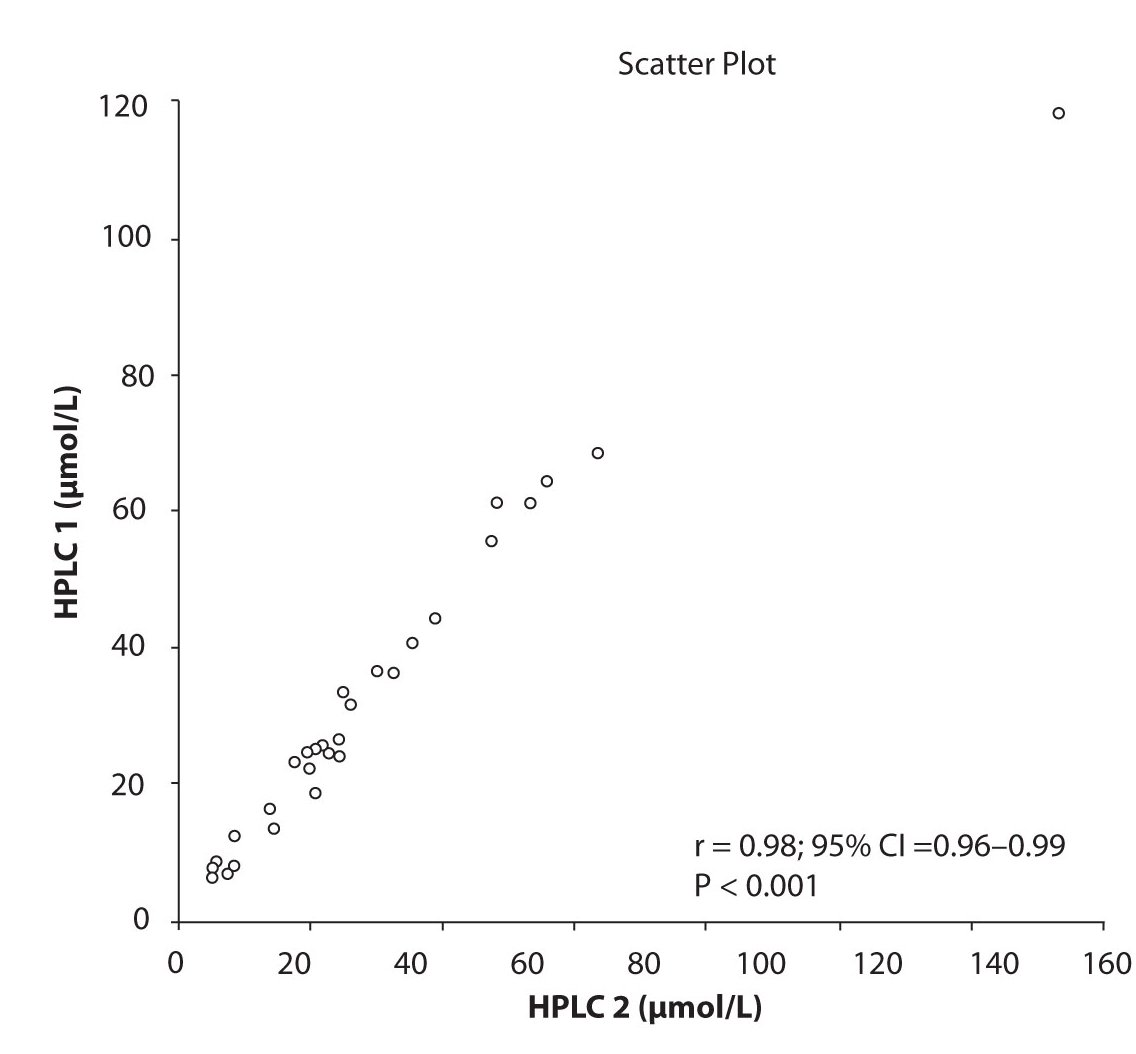
Figure 2c. The comparison of serum concentration of PHT between HPLC 1 and HPLC 2
In addition possible differences between two different HPLC systems were further evaluated by comparison of correlations between CBZ and its metabolite, EPO-CBZ. The correlation coefficients between CBZ and EPO-CBZ measured by HPLC in two different labs are shown in the Figure 3a and 3b. The correlations between CBZ and EPO-CBZ in both HPLC systems were moderate, i.e. r = 0.486 (P < 0.001) for HPLC 1 and r = 0.427 (P < 0.001) for HPLC 2. The correlation between HPLC 1 and HPLC 2 in measurement of EPO-CBZ was good (R = 0.88, P < 0.001).
In order to compare two analytical methods and two HPLC using different commercial kit we applied the comparison by Passing-Bablok method. The detail results between different HPLC (HPLC 1 and HPLC 2) and between HPLC and immunoassay we have presented in table 1.
The agreement between HPLC 1 and HPLC 2 in the determination of CBZ, PHT and CBZ-E we have evaluated through Bland-Altman agreement. This method we used to compare the immunoassay and chromatographic method (HPLC 1 and HPLC 2) and to present difference vs. mean average (Figure 4a-c; 5a-c and 6a). The results of Passing Bablok comparison are presented in the table 1.
Table 1. Passing and Bablok Fit Comparison of CBZ, PHT and EPO-CBZ serum concentrations measured by HPLC 1, HPLC 2 and CEDIA Immunoassay (µmol/L).
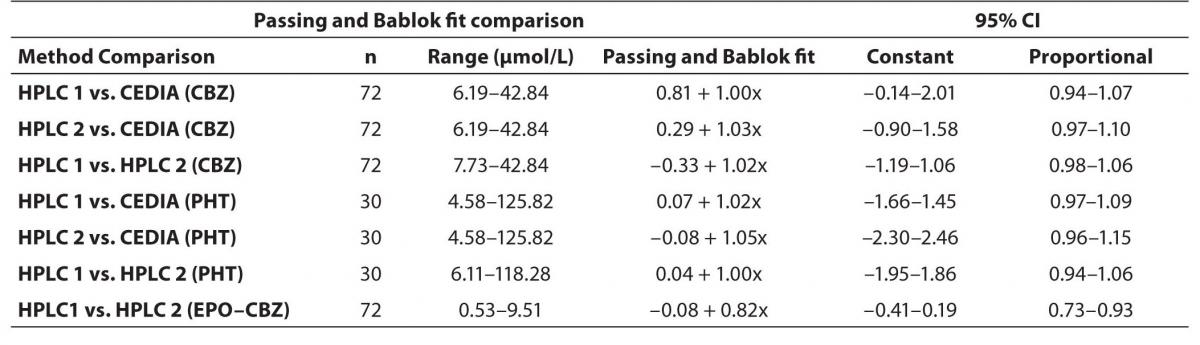
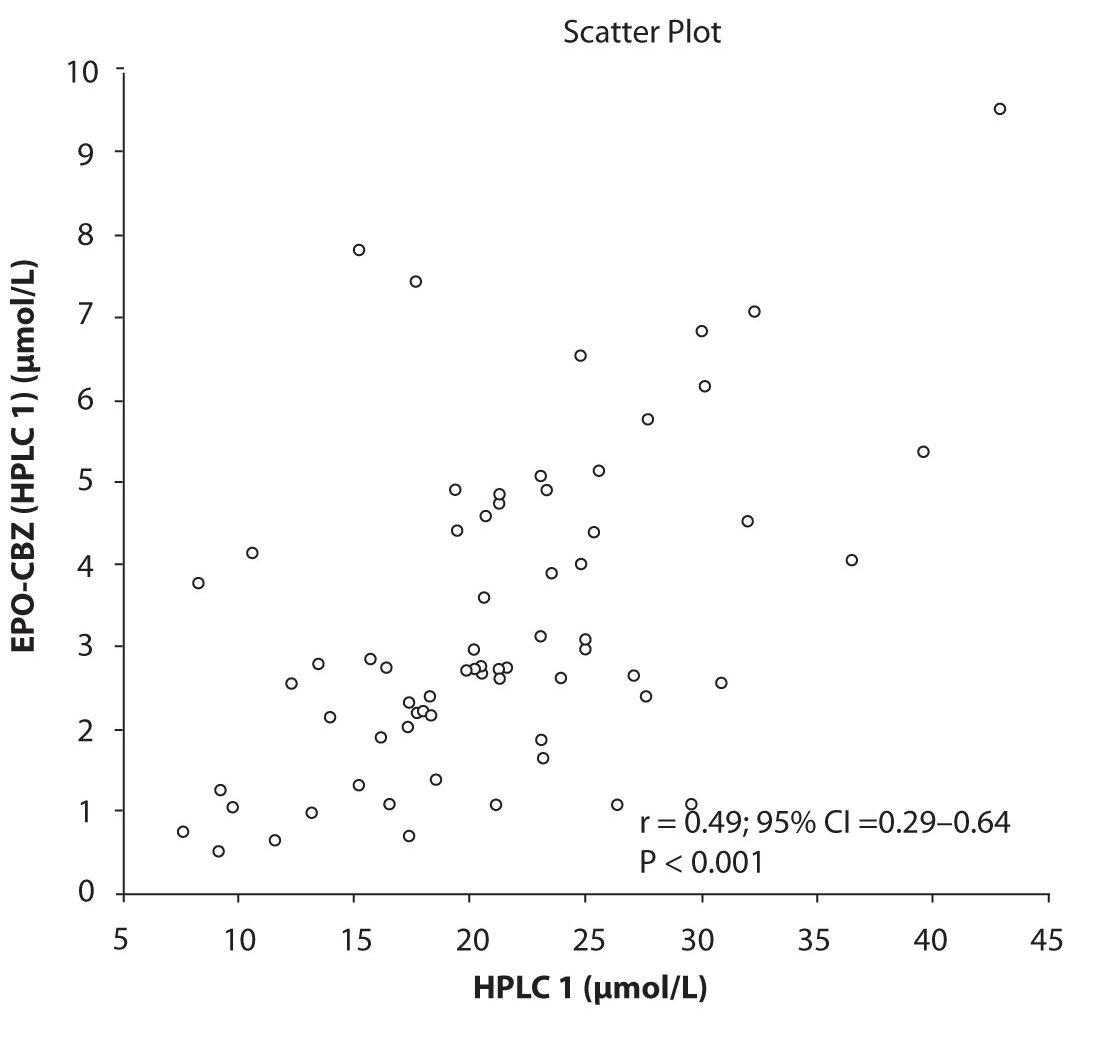
Figure 3a. Comparison between serum concentration of CBZ and CBZ-E: HPLC 1
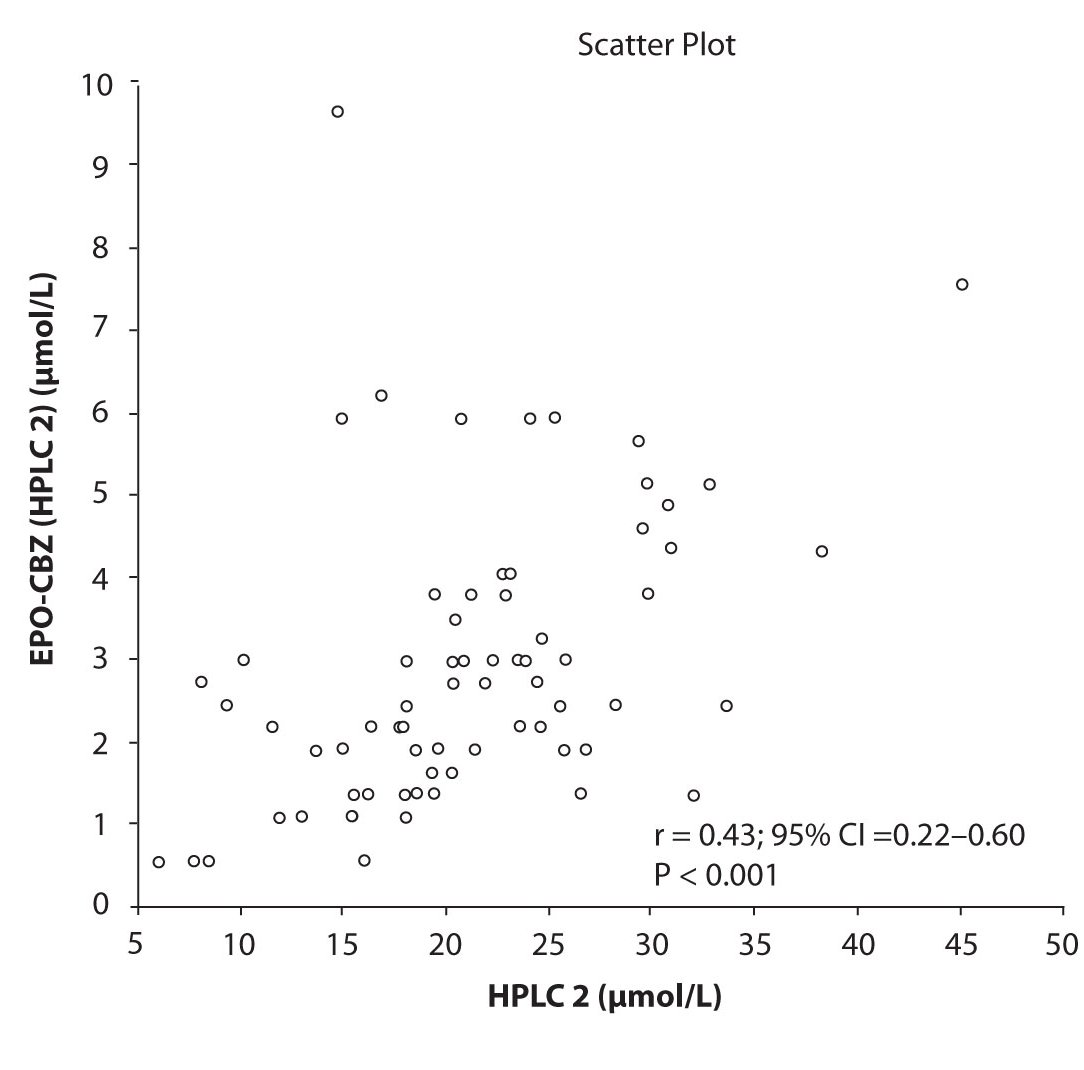
Figure 3b. Comparison between serum concentration of CBZ and CBZ-E: HPLC 2
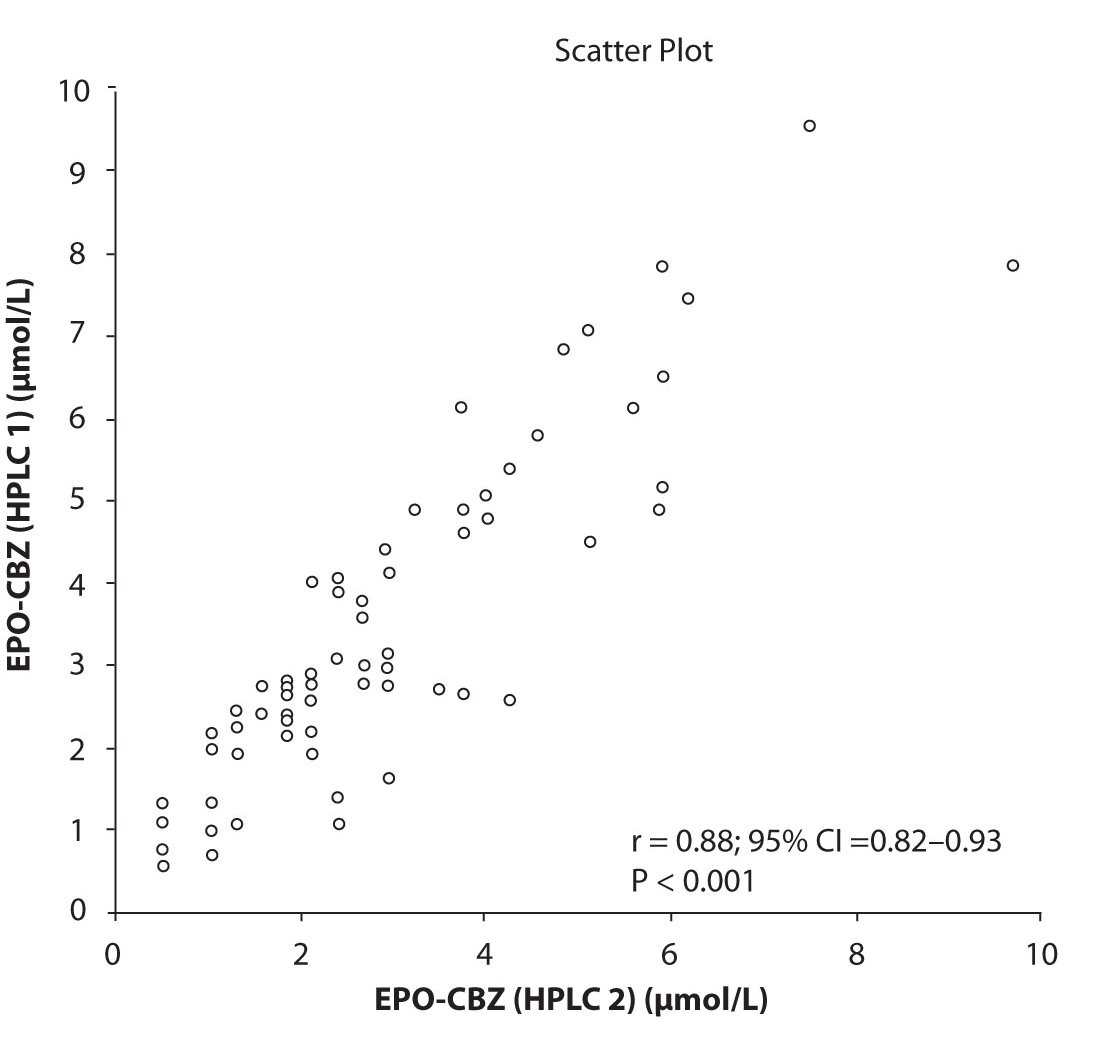
Figure 3c. Comparison between serum
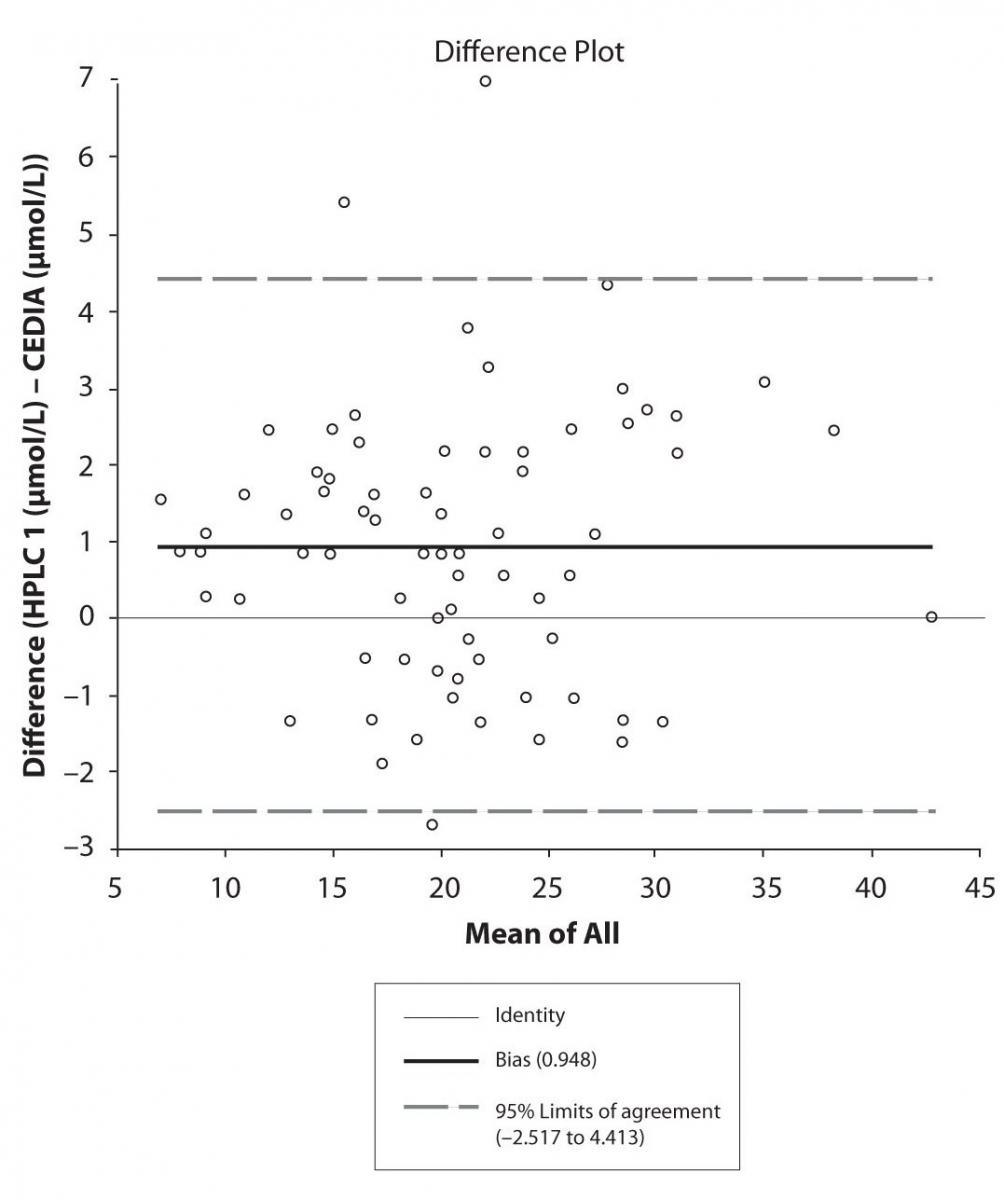
Figure 4a. Bland-Altman plot: Difference HPLC1 vs. concentration of EPO-CBZ (HPLC 1) and EPO-CBZ (HPLC 2) CEDIA (CBZ)
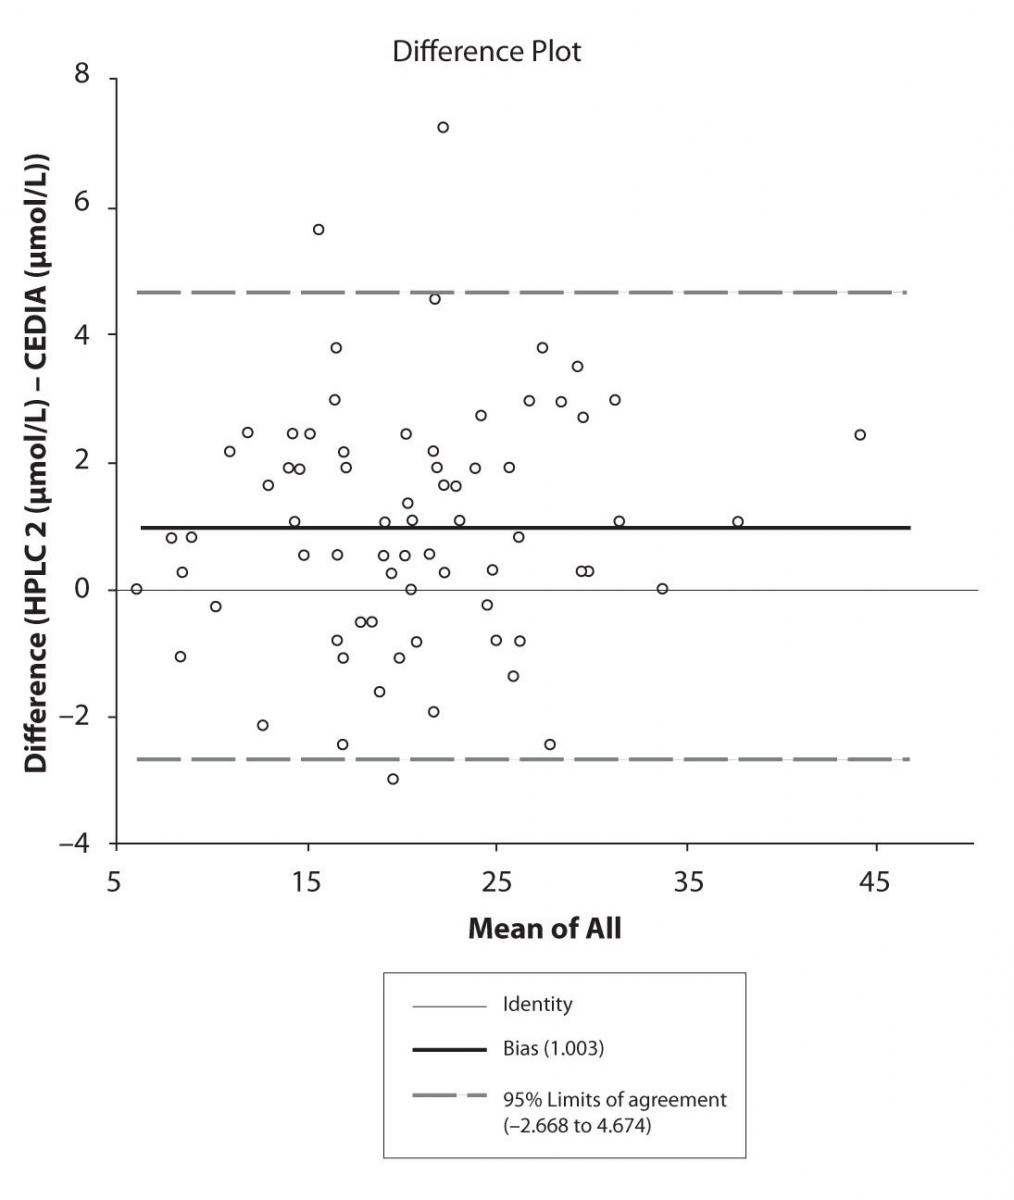
Figure 4b. Bland-Altman plot: Difference HPLC2 vs. CEDIA (CBZ) 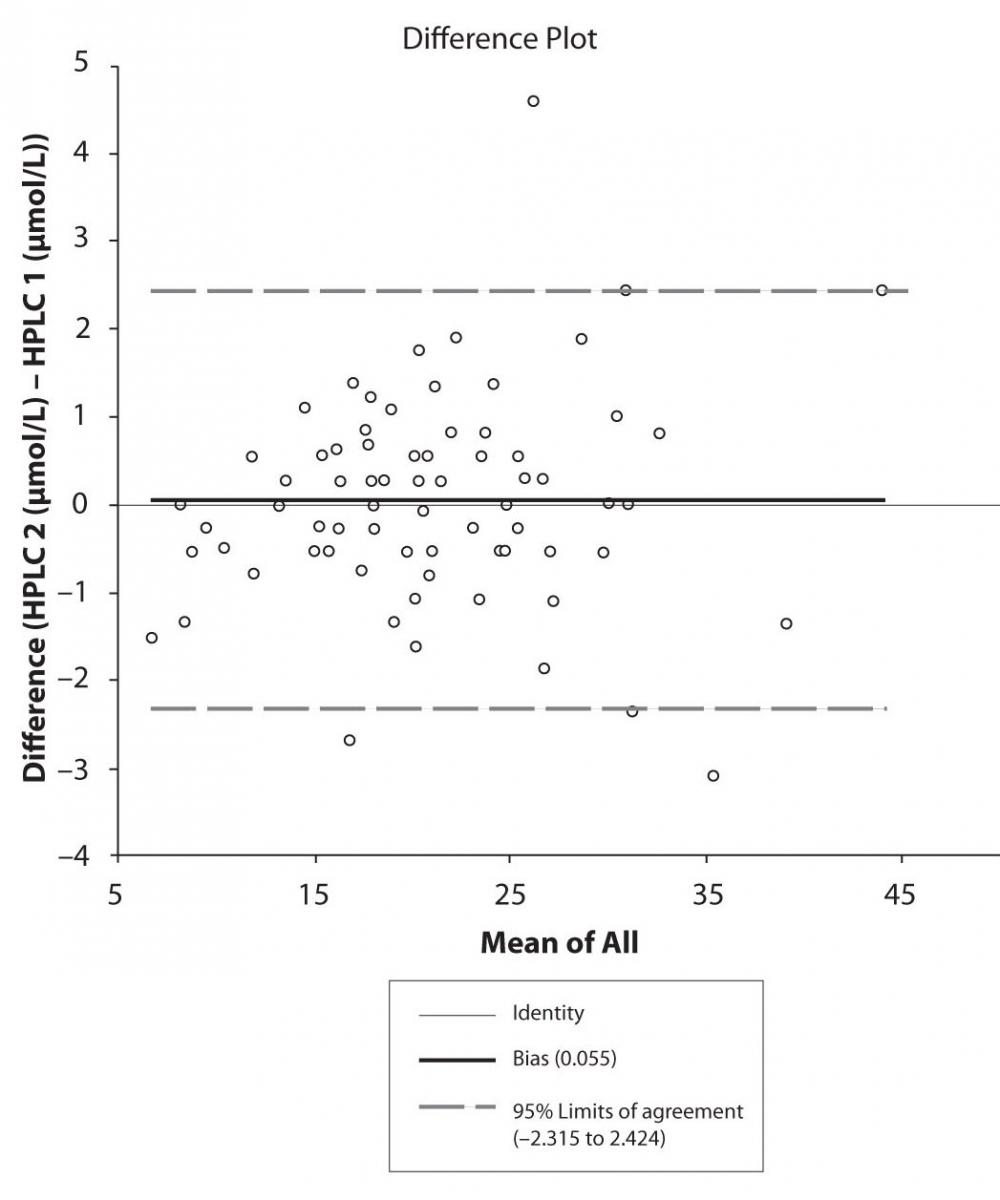
Figure 4c. Bland-Altman plot: Difference HPLC1 vs. HPLC2 (CBZ)
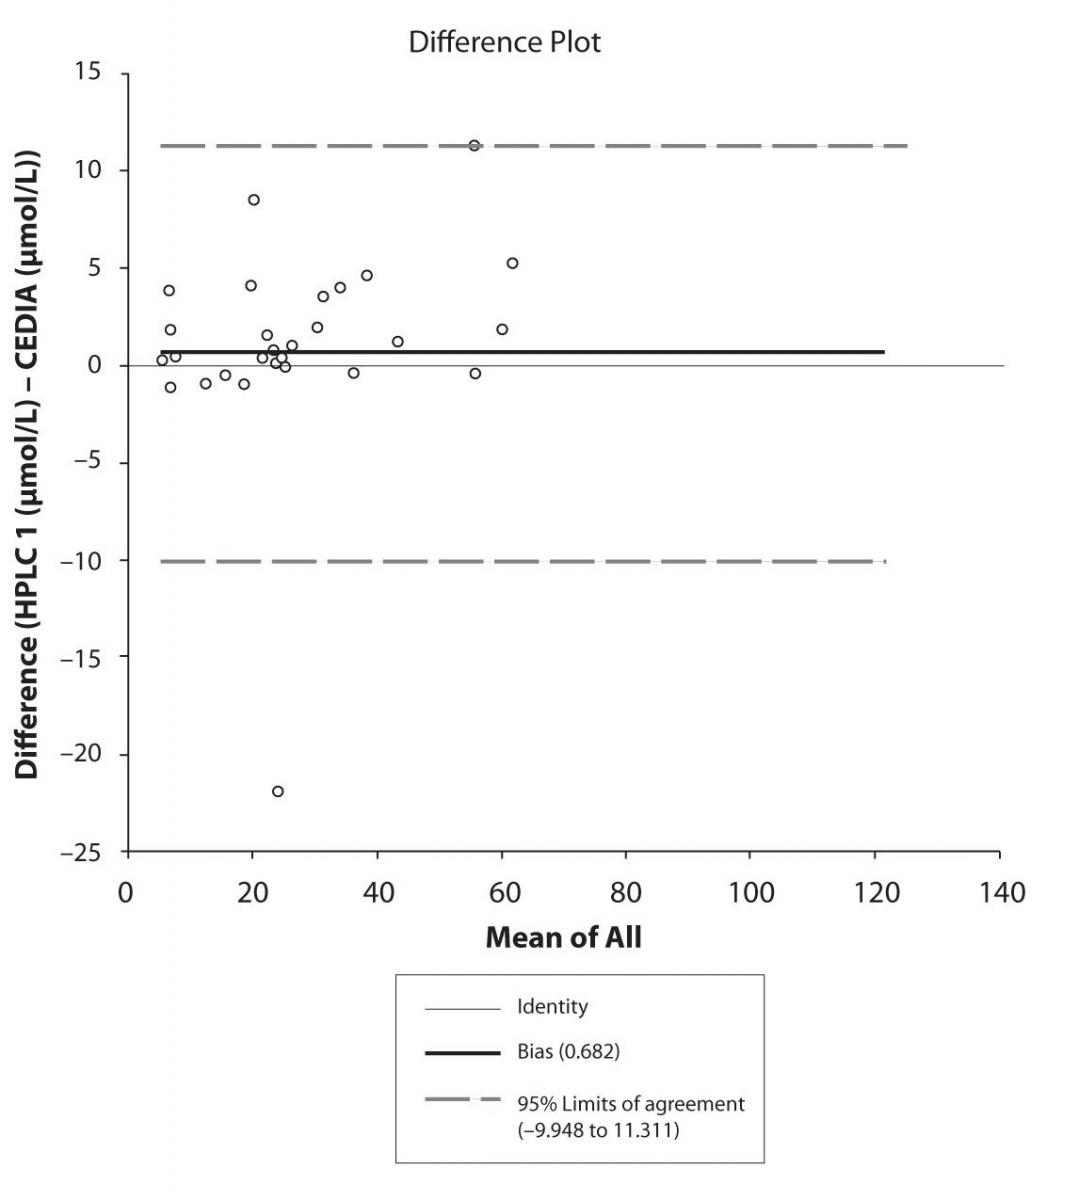
Figure 5a. Bland-Altman plot: Difference HPLC1 vs. CEDIA (PHT) 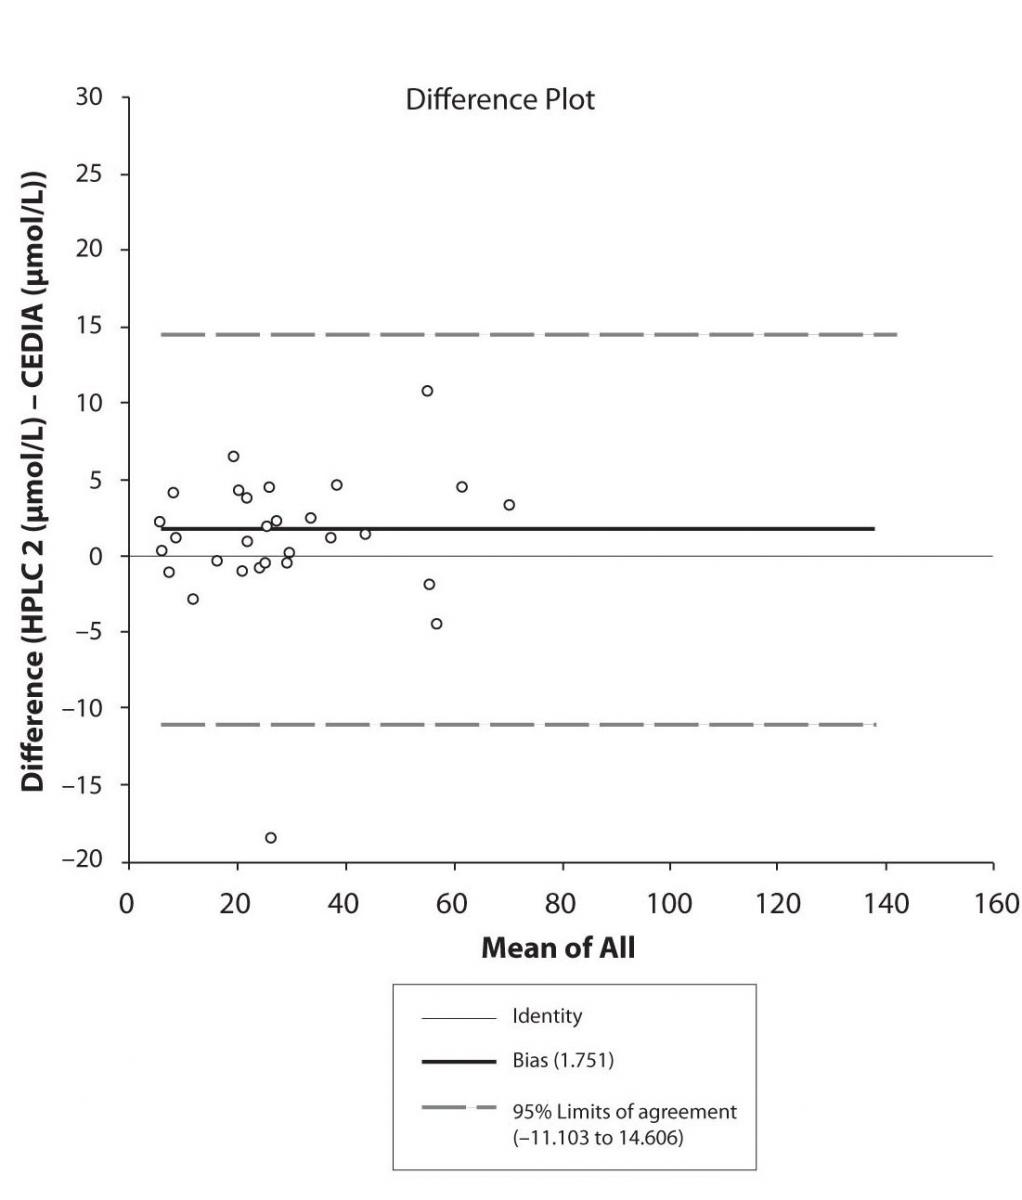
Figure 5b. Bland-Altman plot: Difference HPLC2 vs. CEDIA (PHT)
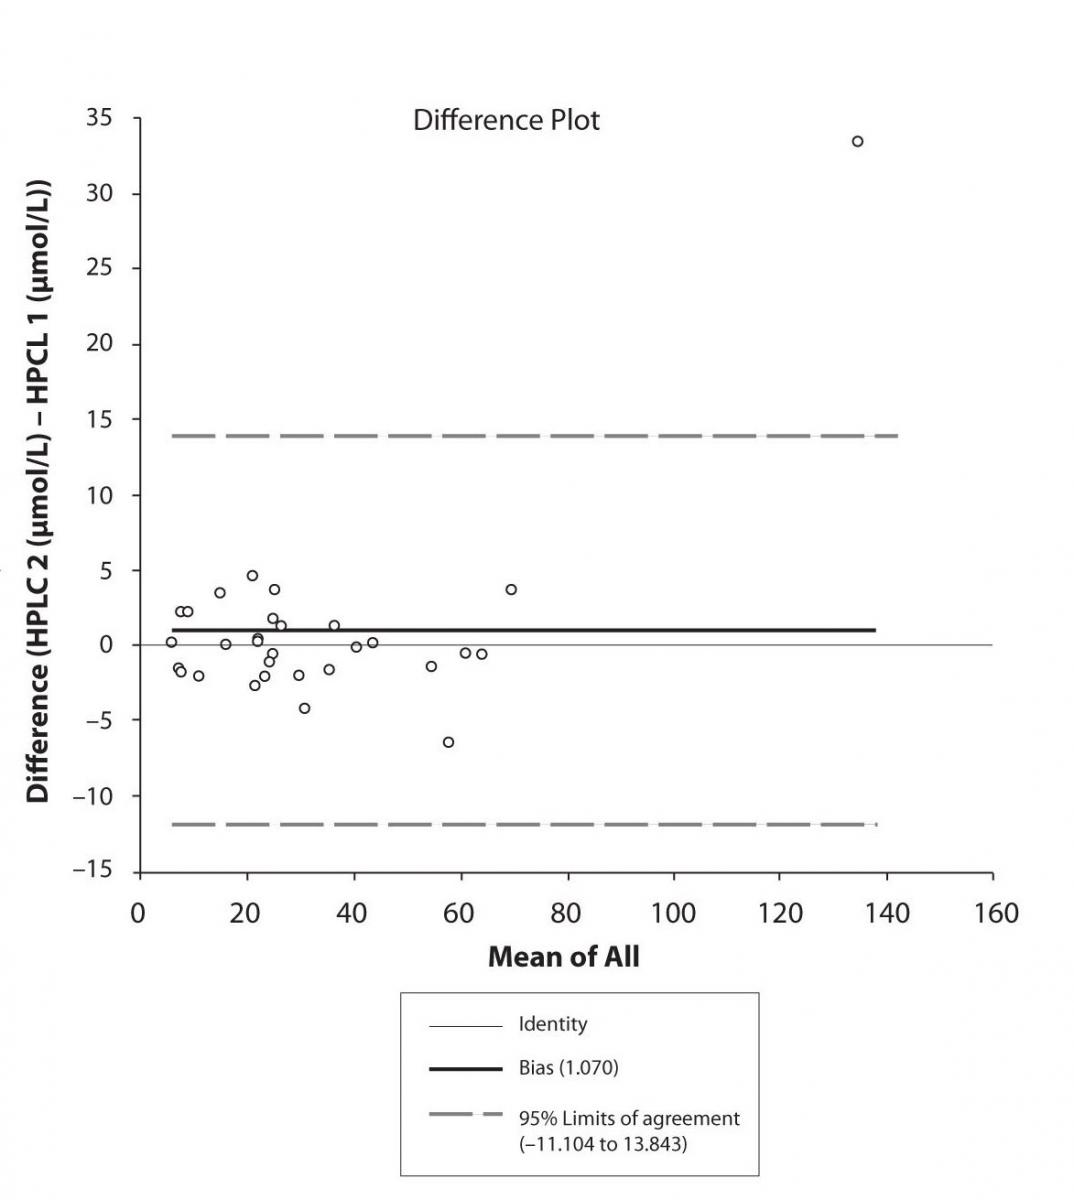
Figure 5c. Bland-Altman plot: Difference HPLC1 vs. HPLC2 (PHT)
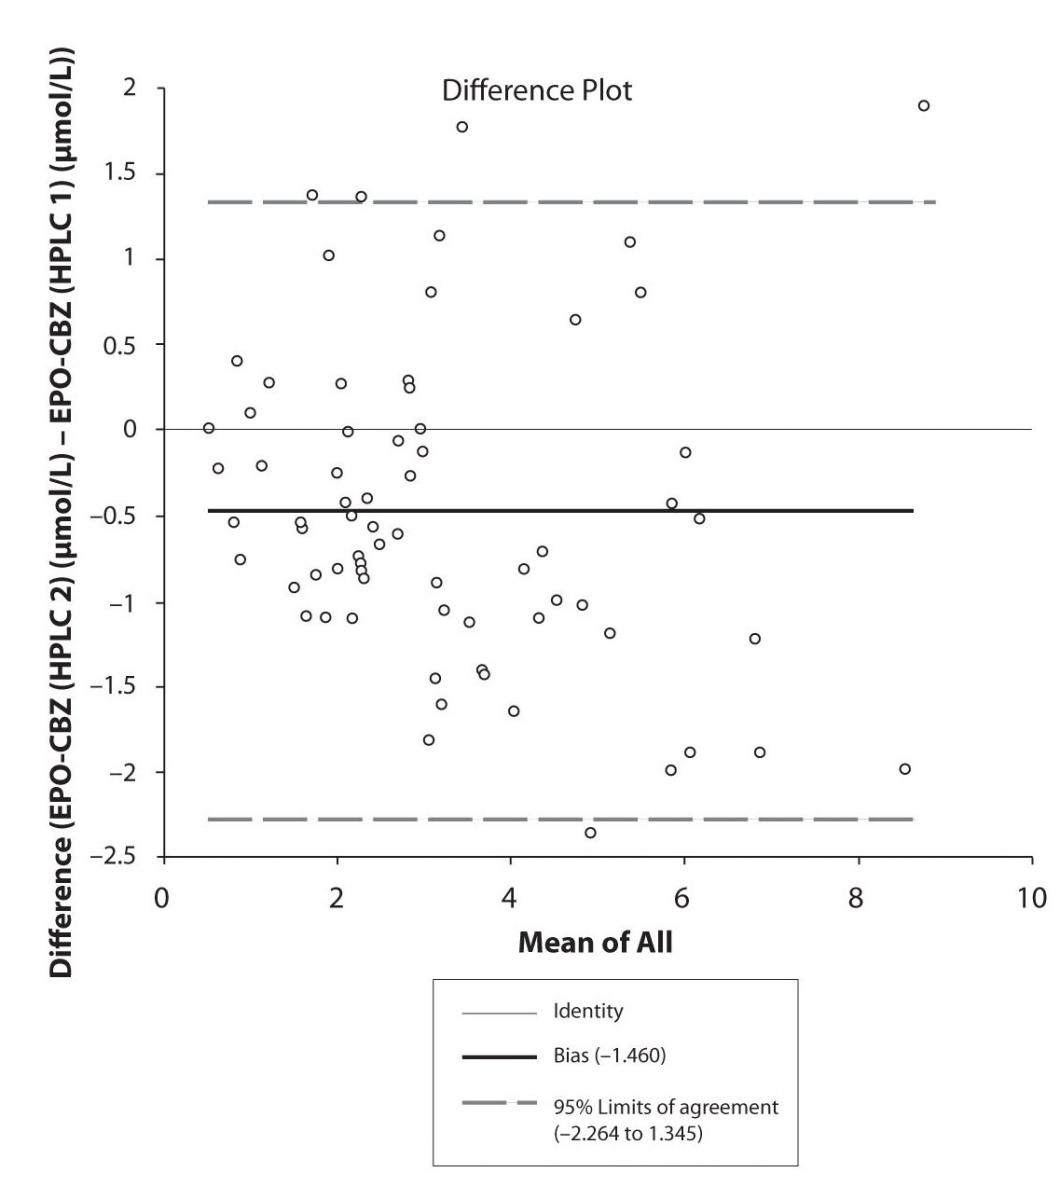
Figure 6a. Bland-Altman plot: Difference HPLC1 vs. HPLC2 (EPO-CBZ)
Discussion
TDM as routine service includes the measurement of serum concentrations of numerous drugs presenting widely varying chemical structures. Thus, in the TDM service a compromise has to be made between using the best method for each individual analyte and using the techniques that allow quantization of wide range of substances.
In our study besides the correlation between two analytical methods (immunoassay-CEDIA and HPLC), we attempt to present the impact of different HPLC systems with different procedures of validation. The correlation between two HPLC systems and correlation between two HPLC methods and immunoassay method (CEDIA) observed in the present study proved very satisfactory for CBZ and PHT.
The correlation coefficient of serum concentration of CBZ and PHT between the HPLC 1 and CEDIA in our study were the same (each r = 0.974), while the correlations of serum concentrations of CBZ and PHT between the HPLC 2 and CEDIA in our study were slightly different (r = 0.969 and r = 0.990). The above findings almost match results of Rambeck et al., who found that in the case of PHT there was a highly linear correlation (r = 0.985, y = 1.113x - 0.589) between HPLC and the Biotrack system, while in the case of CBZ, the correlation between HPLC and Biotrack system was somewhat lower (r = 0.931, y = 1.29x - 0.136) (14). Similar results of correlation have found others authors, too (15,16).
In contrast to immunoassay, the TDM of CBZ using the chromatography system enables to measure the concentrations of CBZ-E. The determination of CBZ-E presents an advantage in TDM concerning the fact that this metabolite has similar pharmacological activity to the parent drug (17,18), and this should be considered in the optimization of CBZ therapy (19). In our study we noted the moderate correlation between CBZ and CBZ-E level determined by HPLC 1 (r = 0.486) and HPLC 2 (r = 0.427). Previous authors confined the variability of correlation between the CBZ and its metabolite, CBZ-E. Mihaly et al. presented moderate correlation coefficient of plasma concentrations of CBZ and its metabolite, CBZ-E (r = 0.495) (20). Mihaly suggested that there was a considerable inter-subject variation in the metabolism of CBZ to CBZ-E, without presenting any other possible factor. Semah et al. observed correlation between CBZ and CBZ-E plasma levels found in the mono-therapy group, but not in the poly-therapy group (21).Further we found a good correlation in determination of CBZ-E serum concentration between HPLC 1 and HPLC 2.
Unfortunately, in our study were not able to determine which serum samples present mono-therapy or poly-therapy of CBZ.
Pasing-Bablok regression and Altman – Bland plots supported the comparison between two different HPLC and between chromatography and immunoassay. The Bland-Altman scatter diagram showed the differences plotted against the averages of the two measurements, drawing the mean difference, and the limits of agreement, defined as the mean difference plus and minus 1.96 times the standard deviation of the differences. The results showed the good agreement between different measurement techniques.
Conclusion
The correlation between 2 analytical methods and between 2 HPLC systems is very good indicating the complementarities of results of TDM in both institutions.
The moderate correlation between CBZ and CBZ-E obtained in our study by both HPLC systems show the possible implication of other pharmacokinetic factors and possible concomitant AED that was not subject of investigation in this study. The analytical determination of CBZ-E could be advantage of chromatography in comparison with CEDIA immunoassay.
Notes
Potential conflict of interest
None declared.
References
1. Patsalos PN. Antiepileptic drug pharmacokinetics. Ther Drug Monit 2000; 22:127-30.
2. Patsalos PN, Berry DJ, Bourgeois BF, Cloyd JC, Glauser TA, Johannessen SI, et al. Antiepileptic drugs - best practice guidelines for therapeutic drug monitoring: A position paper by the subcommission on therapeutic drug monitoring, ILAE Commission on Therapeutic Strategies. Epilepsia 2008:1-38.
3. Eadie MJ. Plasma antiepileptic drug monitoring in a neurological practice: A 25-year experience. Ther Drug Monit 1994;16:458-68.
4. Sjöqvist F, Borga O, Dahl ML, et al. Fundamentals of clinical pharmacology. In: Avery’s Drug Treatment 4th Edition, Adis International Limited, New Zealand, 1997, 1–73.
5. Perucca E. Marketed New Antiepileptic Drugs: Are They Better Than Old-Generation Agents? Ther Drug Monit 2002;24:74-80.
6. Bertilson L, Tomson T. Clinical pharmacokinetics and pharmacological effects of carbamazepine and carbamazepine-10, 11-epoxide. An update Clin Pharmacokinet 1986;11:177–98.
7. Hermida J, Tutor JC. How suitable are currently used carbamazepine immunoassays for quantifying carbamazepine-10, 11-epoxide in serum samples. Ther Drug Monit 2003;25:384-8.
8. Clancy CE, Kass RS. Pharmacogenomics in the treatment of epilepsy. Pharmacogenomics 2003;4:747-51.
9. Desta Z, Zhao X, Shin JG, Flockhart D. Clinical significance of the cytochrome P4502C19 genetic polymorphism. Clin Pharmacokinet 2002;41:913-58.
10. Thomson AH, Brodie MJ. Pharmacokinetic optimization of anticonvulsant therapy, Clin Pharmacokinet 1992;23:216-30.
11. Slavica Dodig. Interferences in quantitative immunochemical methods. Biochem Med 2009;19:50-62.
12. Bablok W, Passing H, Bender R, Schneider B. A general regression procedure for method transformation. Application of linear regression procedures for method comparison studies in clinical chemistry. Part III. J Clin Chem Clin Biochem 1988;26:783–90.
13. Hermida J, Boveda MD, Javier F, Vadillo FJ, Tutor JC. Comparison between the Cobas Integra immunoassay and high performance liquid chromatography for therapeutic monitoring of carbamazepine. Clin Biochem 2002;35:251-4.
14. Rambeck B, May TW, Jürgens MU, Blankenhorn V, Jürges U, Korn-Merker E, Sälke-Kellermann A. Comparison of phenytoin and carbamazepine serum concentrations measured by high-performance liquid chromatography, the standard TDx assay, the enzyme multiplied immunoassay technique, and a new patient-side immunoassay cartridge system. Ther Drug Monit 1994;16:608-12.
15. May TW, Rambeck B, Jürges U, Blankenhorn V, Jürgens U. Comparison of Total and Free Phenytoin Serum Concentrations Measured by High-Performance Liquid Chromatography and Standard TDx Assay: Implications for the Prediction of Free Phenytoin Serum Concentrations. Ther Drug Monit 1998;20:619-23.
16. Oles KS, Penry JK, Dver RD. Evaluation of an enzyme immunochromatography method for carbamazepine: a comparison with enzyme-multiplied immunoassay technique, fluorescence polarization immunoassay, and high-performance liquid chromatography. Ther Drug Monit 1989;11:471-6.
17. Potter JM, Donnelly A. Carbamazepine-10,11-epoxide in therapeutic drug monitoring. Ther Drug Monit 1998;20:652–7.
18. Davies JA. Mechanisms of action of antiepileptic drugs. Seizure 1995;4:267–71.
19. Warner A, Privitera M, Bates D. Standards of laboratory practice: antiepileptic drug monitoring. Clin Chem 1998;44:1085–95.
20. Mihaly G, Phillips A, Louis W, Vajda F. Measurement of Carbamazepine and Its Epoxide Metabolite by High-Performance Liquid Chromatography, and a Comparison of Assay Techniques for the Analysis of Carbamazepine. Clin Chem 1997;23/12:2283-2287.
21. Semah F, Gimenez F, Longer E, Laplane D, Thuillier A, Baulac M. Carbamazepine and its epoxide: an open study of efficacy and side effects after carbamazepine dose increment in refractory partial epilepsy, Ther Drug Monit 1994;16:537-40.