Introduction
The metabolic syndrome (MetS) represents a cluster of metabolic disorders including abdominal obesity, dyslipidemia (elevated triglycerides and lowered high-density lipoprotein cholesterol (HDL-cholesterol)), hyperglycemia and hypertension (1). These metabolic abnormalities are associated with increased risk for cardiovascular disease and type 2 diabetes mellitus (2,3). It is estimated that about 20-30% of the world’s adult population has MetS (3). Diagnostic criteria for MetS have changed during the last decade with new insights into the pathogenesis of disease. Different health organizations had proposed their own criteria and finally in 2009, a new harmonized definition was accepted (1). MetS is diagnosed when any three of the following five criteria are met: increased waist circumference (with population- and country-specific cut points), triglycerides of at least 150 mg/dL (≥ 1.7 mmol/L), HDL-cholesterol less than 40 mg/dL (< 1.0 mmol/L) in males and less than 50 mg/dL (< 1.3 mmol/L) in females, blood pressure of at least 130/85 mmHg and fasting glucose of at least 100 mg/dL (≥ 5.6 mmol/L) (1). Recommended waist circumference thresholds for Europids are ≥ 94 cm for men and ≥ 80 cm for women (1). Abdominal obesity and physical inactivity are considered as major causes for MetS. Beside this, genetic factors, aging and endocrine disorders, all contribute to the susceptibility for disease (2).
The enzyme 11β-hydroxysteroid dehydrogenase type 1 (11β-HSD1) catalyzes the conversion of the hormonally inactive cortisone to active cortisol, thus facilitating glucocorticoid receptor activation in target tissues. It is a microsomal, nicotinamide adenine dinucleotide-dependent dehydrogenase, identified in many tissues, with highest levels of expression in the liver, gonads, adipose tissue, and brain (4). The similarities between Cushing’s syndrome and MetS lead to the hypothesis that increased cortisol concentrations in adipose tissue are implicated in the pathogenesis of visceral obesity and MetS. A transgenic mouse overexpressing 11β-HSD1 in adipose tissue, became a model for MetS with increased visceral fat mass, glucose intolerance, insulin resistance, dyslipidemia and hypertension (5). In contrast, 11β-HSD1 knockout mice, showed improved insulin sensitivity and lipid profile (6). Various studies (7-16), although not all (17), have reported increased 11β-HSD1 expression in subcutaneous adipose tissue in obese subjects. Some of them confirmed this association also in visceral adipose depots (7,11,16), while others did not (9,18,19). Several researches found positive correlations of 11β-HSD1 subcutaneous fat expression with markers of insulin resistance (10,12,14,15,18,19). Investigations in animal models and early results of human studies suggest that inhibitors of 11β-HSD1 are promising therapeutic drugs for obesity and diabetes (20), further supporting the role of 11β-HSD1 in the pathogenesis of MetS (21).
The gene encoding 11β-HSD1 (HSD11B1) is located on chromosome 1q32-q41. Several studies investigated associations of single-nucleotide polymorphisms (SNPs) of HSD11B1 with metabolic phenotype. Two SNPs within HSD11B1 gene (rs846910: G>A and rs12086634: G>T) have been associated with type 2 diabetes in Pima Indians (15). SNP rs846910: G>A was also associated with hypertension (22). Another polymorphism, insertion of adenine in intron 3 (rs45487298: insA), was associated with obesity and insulin resistance in children (23). On the contrary, Robitaille et al. found no association of three HSD11B1 gene variants with components of the MetS (24). Four other HSD11B1 polymorphisms were not associated with type 2 diabetes or metabolic parameters in Koreans (25).
This is the first study performed in population from Bosnia and Herzegovina, in which we examined a significance of genetic variations in the HSD11B1 gene (rs846910: G>A and rs45487298: insA), in the pathogenesis of MetS. Influence of genotypes on clinical and metabolic parameters was also assessed.
Materials and methods
Subjects
The study included a total of 86 participants from Bosnia and Herzegovina: 43 patients of General Hospital Tesanj, Zenica-Doboj Canton, diagnosed with MetS, and 43 healthy subjects. All research involving human subjects was done in accordance with the ethical recommendations and practices of the General Hospital Tesanj, and compiled with ethical principles of the Declaration of Helsinki. The study was approved by Ethics Committee of Cantonal Hospital Zenica and by the Institute for Genetic Engineering and Biotechnology, University of Sarajevo. Written informed consents were obtained for each participant involved in the study. MetS was diagnosed according to harmonized criteria from 2009 that include three or more of the following abnormalities: waist circumference ≥ 94 cm in men or ≥ 80 cm in women, triglycerides ≥ 1.7 mmol/L (or specific treatment for this lipid abnormality), HDL-cholesterol < 1.0 mmol/L in men or < 1.3 mmol/L in women (or specific treatment for this lipid abnormality), blood pressure ≥ 130/85 mmHg (or treatment for previously diagnosed hypertension) and fasting glucose ≥ 5.6 mmol/L (or previously diagnosed type 2 diabetes) (1). Patients with an acute infection and/or inflammation, endocrine disorders and those on insulin therapy were excluded from the study. Only 9 patients did not receive any therapy; 47% of all patients were treated with lipid-lowering drugs, 58% were treated with glucose-lowering drugs, and 74% received antihypertensive therapy. Control group consisted of 43 age-matched, healthy, non-obese subjects who had less than three features of MetS, and were not taking any medication during the course of the study.
Anthropometric measurements and biochemical markers determination
Height, weight, waist circumference, systolic and diastolic blood pressure were measured in all subjects. Waist circumference was measured at the midpoint between the lowest rib and the iliac crest (26). After overnight fast, blood samples were collected for the determination of following biochemical markers: insulin, glucose, total cholesterol, HDL-cholesterol, low-density lipoprotein cholesterol (LDL-cholesterol), triglycerides, glycohemoglobin (HbA1c) and C-reactive protein (CRP). Whole blood with EDTA was used for HbA1c determination and serum was used for all other measurements. Fasting insulin levels were measured by immunoenzymometric assay on an AxSYM analyzer (Abbott Laboratories, Abbott Park, IL, USA). HbA1c was determined by NGSP certified method based on affinity separation, using the NycoCard reader (Axis-Shield, Oslo, Norway). Other markers were determined by standard methods with the use of autoanalyzer VITROS 350 Chemistry System (Ortho-Clinical Diagnostic, Rochester, New York, USA). The homeostasis model assessment insulin resistance index (HOMA-IR) was calculated using the formula: fasting insulin (mU/L) x fasting glucose (mmol/L) /22.5 (27).
Genetic analyses
Genomic DNA was isolated from peripheral blood using Miller’s protocol (28). Two HSD11B1 gene polymorphisms, rs846910: G>A and rs45487298: insA, were genotyped by previously described high-resolution melting (HRM) method (29). HRM analysis was performed on the LightCycler®480 Real-Time PCR System (Roche Diagnostics GmbH, Mannheim, Germany). Briefly, DNA fragments containing the analyzed polymorphisms were amplified using the following primers and probes: F: 5’-CTC TGT TGC TTG TGC TTG ATT C-3’, R: 5’-AGA GCA GGC TTT CAG CAG ATA C-3’ and unlabeled probe: 5’-CTGGTGGGAATGATCAAATCAGAGAGA-3’ for rs846910: G>A, and F: 5’-GGT GAG GCT GTT TCT CTT ACC T-3’, R: 5’-GGT TGA TAC CTT TCC CAT TCT-3’ and unlabeled probe: 5’-GGT CAC CAA GAG CTT TTG GGA GG-3’ for rs45487298: insA. The amplification protocol consisted of initial denaturation at 95 °C for 10 min and 60 cycles with denaturation at 95 °C for 10 s, then 10 s annealing with a touchdown protocol covering a range of annealing temperatures from 68 to 58 °C (decreasing 1 °C per cycle) and elongation at 72 °C for 10 s. After amplification, PCR products were denatured at 95 °C for 1 min and cooled to 40 °C. High resolution melting was performed by heating from 55 °C to 90 °C with 25 acquisitions per 1 °C.
During each run, two positive control samples for each genotype and one negative control were used for quality control. Positive controls were previously confirmed by PCR-RFLP method (29). Twenty percent of all samples were double-genotyped with 100% concordant results.
Statistical analysis
Statistical analysis was performed using SPSS Statistics 17.0 software. A P value ≤ 0.05 was considered statistically significant. The differences in genotype frequencies between study groups were analyzed by chi-square (χ2) test and Fisher’s exact test (in the case where expected frequencies were less or equal to 5). Genotype association with clinical and biochemical markers was tested by Mann-Whitney test (data did not follow normal distribution). Linkage disequilibrium between two polymorphisms was calculated by 2LD program (30). Haplotype analyses were performed using PHASE 2.1 software (31).
Power analysis was performed using the Quanto program version 1.2.4 (32) and G*Power 3 software available at http://www.psycho.uni-duesseldorf.de/abteilungen/aap/gpower3.
Results
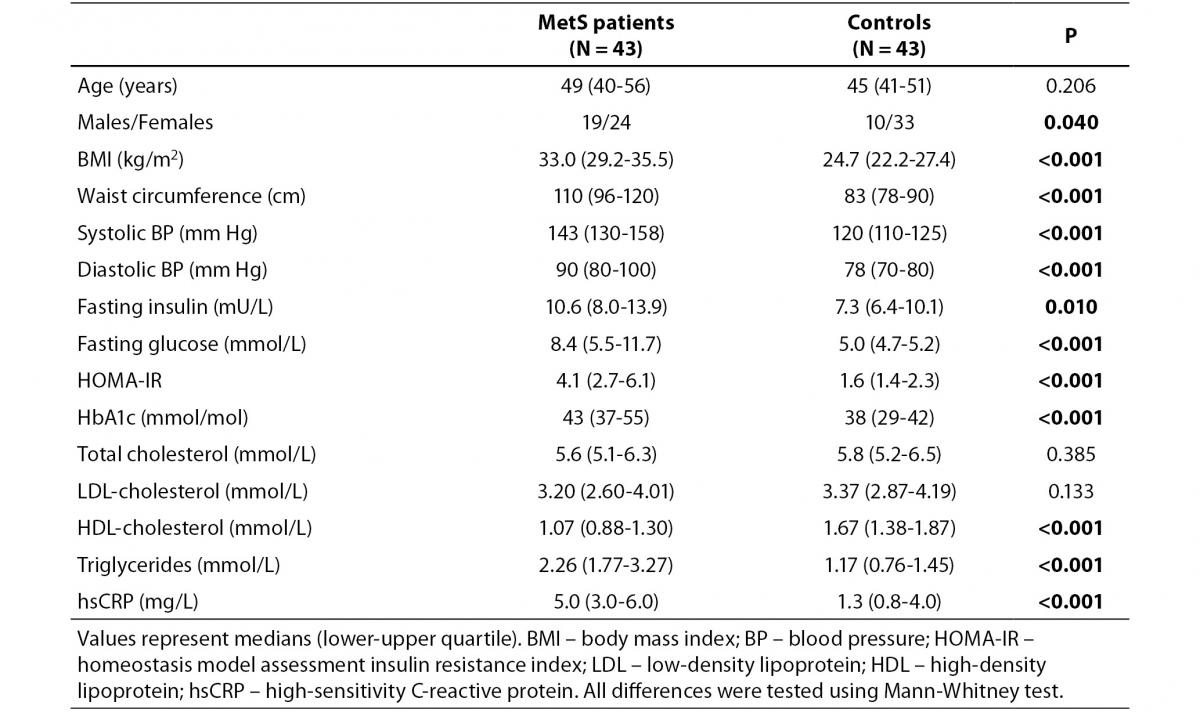
Clinical and biochemical variables of MetS patients and controls are presented in Table 1. Most of the measured anthropometric, hemodynamic and metabolic parameters were significantly different between the two groups except for total and LDL-cholesterol concentration (Table 1).
Table 1. Clinical and biochemical characteristics of MetS patients and controls.
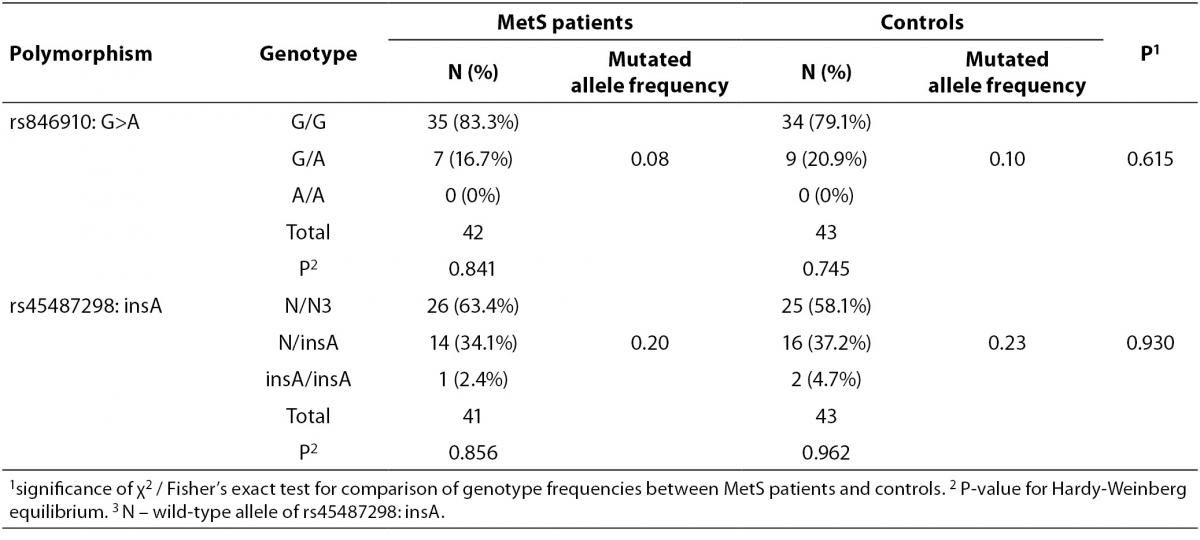
Allele and genotype frequencies for rs846910: G>A and rs45487298: insA variants are presented in Table 2. As the rs846910: G>A polymorphism is rare, there were no homozygous mutant genotypes (A/A). There was no significant deviation from the Hardy-Weinberg equilibrium in two groups of subjects studied, with respect to both polymorphisms Distribution of genotypes did not differ significantly between controls and MetS patients (Table 2). However, the study had limited power to detect potentially small effects of these variants on MetS, which is multifactorial and very complex disease. The power of the study to detect odds ratios (ORs) between 1.2 and 2.0 at α = 0.05 was only 6-24% for rs846910: G>A (dominant model), and 7-33% for rs45487298: insA variant (recessive model). To detect effect sizes of OR = 1.2-2.0, sample sizes of nearly 200-3200 and 150-2000 subjects in each group would be required, for rs846910: G>A and rs45487298: insA polymorphism, respectively.
Table 2. Genotype and variant allele frequencies for rs846910: G>A and rs45487298: insA polymorphisms.
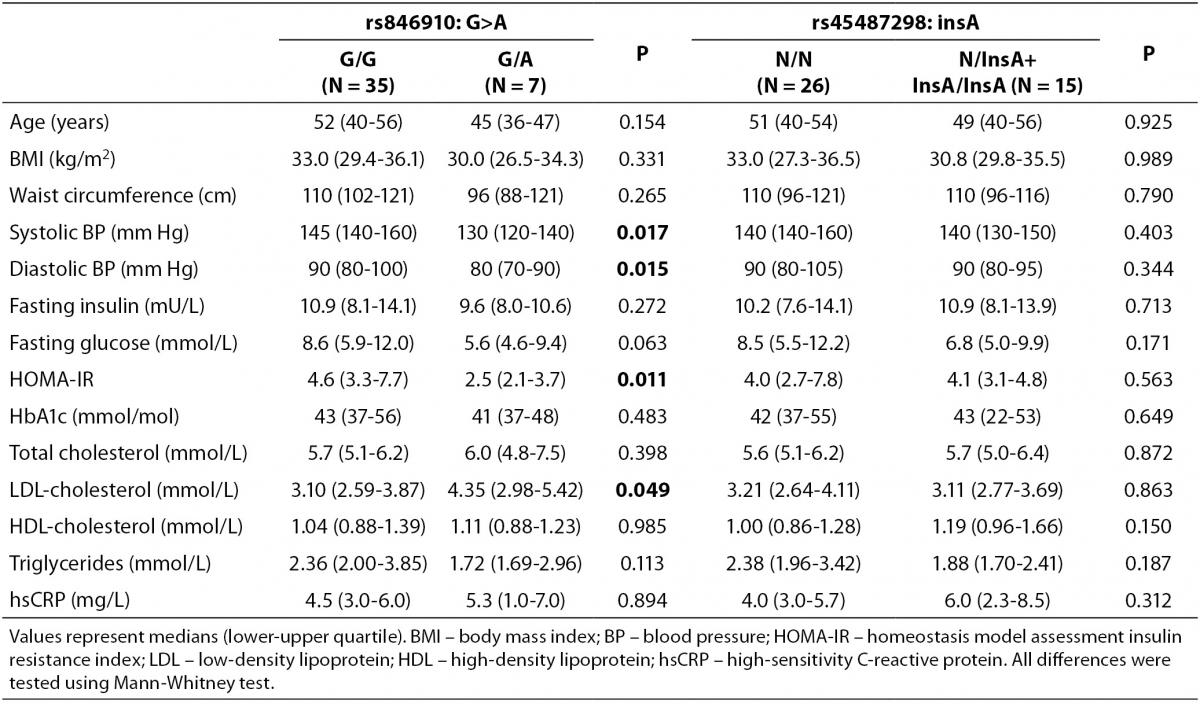
Clinical and metabolic characteristics of patients with MetS according to the genotypes of rs846910: G>A and rs45487298: insA polymorphisms are shown in Table 3. No significant associations between disease-associated traits and rs45487298: insA were found. Regarding rs846910: G>A variant, heterozygous patients (G/A) had significantly lower systolic (P = 0.017) and diastolic blood pressure (P = 0.015), lower HOMA-IR index (P = 0.011) and higher LDL-cholesterol levels (P = 0.049), compared to the wild-type homozygotes.
Table 3. Comparison of clinical and biochemical characteristics between different genotypes of rs846910: G>A and rs45487298: insA polymorphisms in the MetS patients group.
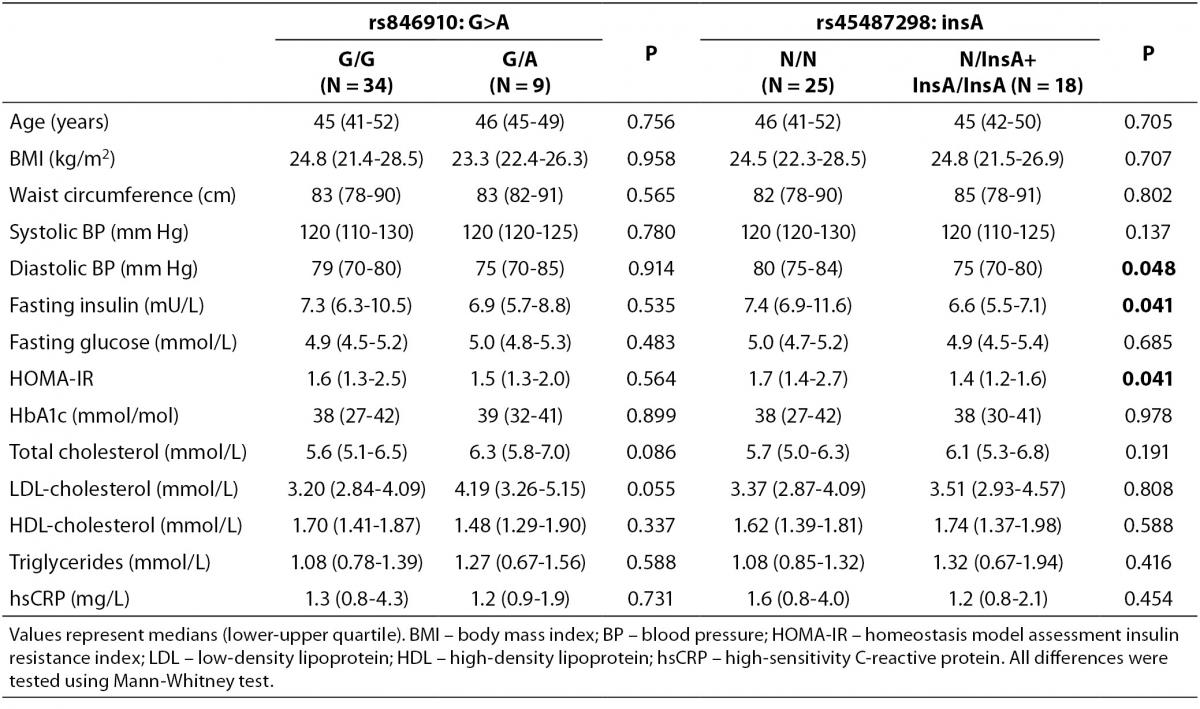
Comparisons of clinical and metabolic parameters between genotypes in the control group are shown in Table 4. The carriers of rs45487298: insA polymorphism had significantly lower fasting plasma insulin (P = 0.041), lower HOMA-IR index (P = 0.041), and lower diastolic blood pressure (P = 0.048), compared to the wild-type homozygotes (Table 4). Significant differences between rs846910: G>A genotypes in control subjects were not detected (Table 4).
Table 4. Comparison of clinical and biochemical characteristics between different genotypes of rs846910: G>A and rs45487298: insA polymorphisms in the control group.
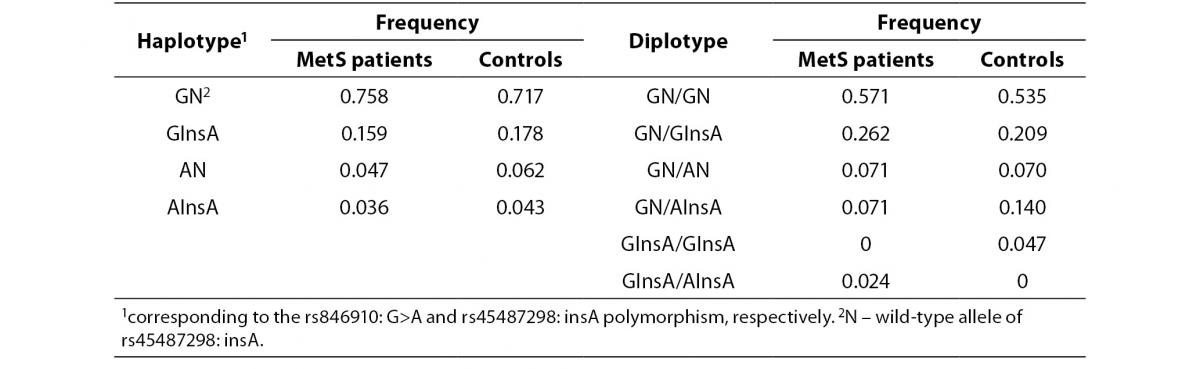
In addition, the haplotype analysis was also performed. The rs846910: G>A and rs45487298: insA polymorphisms were in moderate linkage disequilibrium (D’ = 0.418). Reconstructed haplotype and diplotype frequencies are shown in Table 5. There was no significant difference in distribution of haplotype frequencies between MetS patients and controls (P= 0.90). As AN and AInsA haplotypes were rare, only the associations of GN and GInsA haplotypes with clinical and biochemical markers were tested. By comparing the effects of GN/GInsA and GInsA/GInsA diplotypes together, to complete wild-type diplotype, we examined the potential effect of the InsA polymorphism solely (without rs846910: G>A). In MetS patients group, significant associations were not found (data not shown). In the control group, analysis confirmed the above mentioned results: carriers of GN/GInsA and GInsA/GInsA diplotypes, as compared to GN/GN individuals, had lower fasting insulin level (data presented as median (1st-3rd quartile): 8.1 (7.0-13.9) mU/L vs. 6.2 (4.7-7.1) mU/L; P= 0.011) and lower HOMA-IR index (1.8 (1.4-2.8) vs. 1.3 (0.9-1.6); P = 0.016).
Table 5. Haplotype and diplotype frequencies of rs846910: G>A and rs45487298: insA variants in MetS patients and controls.
For continuous traits, the study had only 25% and 34% power to detect moderate effect sizes of 0.5 at the α level 0.05, for rs846910: G>A and rs45487298: insA variants, respectively. Sample sizes of 200 and 140 subjects would be needed to detect effect sizes of 0.5 with 80% power, for rs846910: G>A and rs45487298: insA polymorphism, respectively.
Discussion
A number of studies have investigated an association of 11β-HSD1 with obesity and insulin resistance in humans. Most of them demonstrated a correlation of adipose HSD11B1 expression with obesity (7-16). Lindsay et al. (14) reported a positive correlation of 11β-HSD1 activity with measures of adiposity, fasting plasma glucose, insulin, and insulin resistance by the homeostasis model. Another study did not find relationship between 11β-HSD1 and insulin sensitivity (33). The role of 11β-HSD1 in the pathogenesis of visceral obesity and insulin resistance has been corroborated by experimental studies with enzyme inhibitors. However, several studies which explored the relationship between HSD11B1 polymorphisms, obesity and type 2 diabetes, gave conflicting results.
In this study, we did not find the association of two investigated HSD11B1 gene polymorphisms, rs846910: G>A in 5’ upstream region and rs45487298: insA in intron 3, with MetS in a sample of Bosnian population. However, our study was preliminary and of limited statistical power due to the insufficient sample size. Our negative findings possibly reflect statistical type 2 errors and the role of investigated genetic variants in MetS risk cannot be ruled out. Analysis of anthropometric and biochemical markers in regards to the genotypes of rs846910: G>A showed significant associations of the mutated A allele with lower systolic (P = 0.017) and diastolic blood pressure (P = 0.015), lower HOMA-IR index (P = 0.011) and higher LDL-cholesterol levels (P = 0.049) in patients with MetS. These results might reflect the influence of rs846910: G>A variant on metabolic control in MetS patients. However, majority of patients in our cohort received therapy and therefore, these associations have to be taken with particular caution. In the control group, rs846910: G>A did not show any significant associations. Since this allele was rare, we could not confirm these results by haplotype analysis . Only a few studies have examined the effect of rs846910: G>A on the metabolic phenotypes. In a study of Pima Indians, mutated A allele was associated with type 2 diabetes and higher fasting insulin concentrations in healthy subjects, independently of obesity (15). In another study, also in Pima Indians, rs846910: G>A was associated with hypertension, although these effects were modified by birth era of subjects (22). However, in a recent study, no effect of rs846910: G>A variation on HSD11B1 promoter activity in vitro was found (34), suggesting that this polymorphism may not have direct functional consequences on the 11β-HSD1 activity in vivo.
Analysis of rs45487298: insA polymorphism, showed a significant association between the variant allele and lower fasting plasma insulin levels (P = 0.041), lower HOMA-IR index (P = 0.041), and lower diastolic blood pressure (P = 0.048), in the control group. In MetS patients group, no significant associations were observed. Haplotype analysis confirmed beneficial effect of rs45487298: insA on markers of insulin resistance in controls with even higher significance (P = 0.011 for fasting plasma insulin and P = 0.016 for HOMA-IR). This polymorphism, as well as another SNP in intron 3, located 40 bp downstream, rs12086634: T>G, reduce HSD11B1 transcriptional activity 2.5 x in vitro (35). These two mutations are in 100% linkage disequilibrium. Interestingly, in the above mentioned study of Pima Indians, the wild-type allele of rs12086634: T>G was associated with type 2 diabetes (15). It was also associated with higher insulin-mediated glucose disposal rate (15). The authors suggest that the mechanism of association with markers of insulin resistance, independently of obesity, could be modulation of 11β-HSD1 expression in pancreatic beta cells, that is, a tissue-specific regulation of HSD11B1 (15). On the contrary, in a study sample of healthy overweight and normal weight children from different racial backgrounds, mutated homozygotes for rs45487298: insA had greater BMI, waist circumference and insulin resistance indices than heterozygote or wild-type children (23). Although no significant differences were found between the heterozygote and wild-type children in this study, heterozygotes had actually the lowest BMI, waist circumference, insulin concentration, and HOMA-IR index (23). This is partially in accordance with our results. Since there were only 2 homozygous mutant subjects in our study, we were not able to differentiate between the effects of mutated hetero- and homozygotous state on phenotype.
Robitaille et al. showed no association of rs45487298: insA and rs12086634: T>G polymorphisms with MetS in French-Canadian men (24). Variants were not associated with components of the MetS, except for higher plasma apolipoprotein B levels (24). Several other studies found also no association of rs45487298: insA or rs12086634: T>G with metabolic characteristics (36-39).
As mentioned above, cohort of several hundreds of subjects, depending on variant allele frequency, would be required to detect moderate effect sizes of two analyzed HSD11B1 polymorphisms, and thousands of individuals would be needed to detect potentially small contributions of these variants to the complex phenotype of MetS. In general, many genetic association studies fail to replicate initial positive findings (40). Quality of these investigations depends on methodological issues related to phenotyping and genotyping, and issues related to the study design (40). The key determinant of the quality and the most critical issue is the sample size (40,41). Beside this, the proper definition of phenotype/disease is essential for the quality of a genetic association study (40). This is especially important for studies of MetS, since criteria for diagnosis were changing throughout the last decade and population of MetS patients represent very heterogeneous group.
The results of our preliminary study indicated a positive effect of rs45487298: insA variation on blood pressure and markers of insulin sensitivity in the control group. However, these positive findings have to be replicated in a larger cohort of subjects. Several genetic association studies performed so far, yielded inconsistent results. The discrepancy might be also attributed to the ethnic and environmental differences between studied cohorts. Furthermore, other, yet unidentified genetic variants in HSD11B1 gene or mutations in H6PD, the gene encoding the hexose-6-phosphate dehydrogenase (enzyme needed for 11β-HSD1 reductase activity), can also influence expression or activity of 11β-HSD1. Nonetheless, the role of 11β-HSD1 in insulin sensitivity and obesity seems to be complex and may be explained by its tissue-specific expression patterns.
In conclusion, this is the first study performed in population from Bosnia and Herzegovina, in which a significance of genetic variations of HSD11B1 gene was investigated in the pathogenesis of metabolic syndrome. We found a significant association between rs45487298: insA, HSD11B1 gene polymorphism, and lower fasting plasma insulin and HOMA-IR index, as measures of insulin resistance in the control subjects. However, associations of this SNP with BMI and waist circumference, as markers of obesity, were not found. Future investigations including larger cohorts of subjects, as well as studies in other populations, are needed to substantiate these findings.
Acknowledgements
We greatly appreciate the technical assistance of Mr. Nermin Kotoric, Mr. Hajrudin Mujic and Ms. Elma Topic.