Introduction
Elevated concentrations of lipids in the blood have been associated with an increased risk of cardiovascular morbidity and mortality (1). Monitoring cardiovascular disease risk and reducing the onset of cardiovascular events by therapeutic lifestyle changes and drug therapy has received increasing international attention since 1980 (2,3). The detection, evaluation and treatment of hyperlipidemia are based on circulating blood lipid concentrations among which total cholesterol (TC) and triglycerides (TG). The classification of individuals based on lipid profile represents a general guidance for clinical decision making.
In this context, portable devices such as the Accutrend system (Roche Diagnostics GmbH, Mannheim, Germany) offer a number of advantages over conventional laboratory machinery. The major benefits include fast, minimally invasive and easy blood collection, and immediate ambulatory determination of blood lipid profile. In the past, validation of the capillary Accutrend system for the measurement of circulating lipids has led to conflicting results (4-11). In a number of studies, the Accutrend was found to be sufficiently accurate for clinical use; conversely, others concluded that the precision and the control range of the measuring device (i.e. range of 3.88-7.76 mmol/L for TC and 0.80-6.86 mmol/L for TG) are insufficient for patient evaluation (4-11). The control range is the measurement range in which the Accutrend produces “real” values of the concentration of blood markers. Within this range linearity of the method is insured by the manufacturer. Below or above this measurement range the Accutrend produces no exact values, but gives an indication of the value with “low” or “high”. There is evidence indicating that the newly developed Accutrend® Plus device (Roche Diagnostics GmbH, Mannheim, Germany) has been improved for in vivo diagnostic use (9). However, validation of this upgraded optical reflectance system is scarcely reported in the scientific literature. Since it remains unclear under which circumstances the use of this particular system is appropriate, the aims of this study were: 1) to determine the day-to-day reproducibility of the Accutrend® Plus device; 2) to assess the accuracy of the Accutrend® Plus system by comparing its results to those obtained by a reference laboratory method for monitoring lipid profile in adults; and 3) to assess the concordance between both methods for classifying subjects according to the National Cholesterol Education Program (NCEP).
Materials and methods
Subjects
Twenty-seven male volunteers with a median age of 32.0 years (ranging from 19 to 70 years) and thirty-four female volunteers with a median age of 33.5 years (ranging from 20 to 69 years) were recruited by advertising in the Greater Brussels area, Belgium. All participants were apparently healthy and without cardiovascular history. The study procedures were in accordance to the World Medical Association’s Declaration of Helsinki (12). The study protocol was approved by the local ethical committee and all participants provided written informed consent.
Methods
All venous and capillary blood lipid concentrations were determined in the morning after an overnight fasting period of at least eight hours. In each subject venous and capillary blood samples were collected at the same time. Supplementary capillary sampling was performed at two consecutive days following the first collection. Capillary TC and TG concentrations were determined with the Accutrend® Plus using two drops of blood (15-40 μL) collected from different fingers, by using a lancing device (Accu-chek® Softclix® Pro, Roche Diagnostics GmbH, Mannheim, Germany). The Accutrend® Plus test is a capillary serum test. It is based on the retention of blood cells by filtration via a glass fibre fleece when a drop of blood is applied to the test strip. The enzymatic reaction that takes place in the underlying zone of the strip requires an adequate oxygen supply and results in the formation of a colored oxidation product. The reflectance of the strip (measured at 660 nm) is converted to concentration through a simple algorithm. The intra-assay precision of Accutrend® Plus, as determined by the manufacturer, was 3.7% and 3.4% for TC and TG respectively. The inter-assay precision for Accutrend® Plus determined with control solution by the manufacturer was lower than 5.0% for TC and 2.4% for TG.
Venous blood was collected in Sarstedt S-Monovette® 4.9 mL lithium heparin gel tubes (Sarstedt AG & Co., Nümbrecht, Germany), by using a Termuro® Surflo® winged infusion set (Termuro Europe N.V., Leuven, Belgium). Sera obtained from the venous blood samples were analyzed (blinded for capillary-based values) on a Vitros® 5.1 FS chemistry system (Ortho-Clinical Diagnostics, Johnson & Johnson, Beerse, Belgium), a Cholesterol Reference Method Laboratory Network certified system, using the manufacturer’s reagents and calibrators (13,14). For TC and TG, 5.5 μL of sample was measured by multilayer film dry-slide chemistry with colorimetric detection. The intra-assay precision of Vitros® 5.1 FS, as determined by the manufacturer, was 0.7% for TC and TG. The inter-assay precision was 1.5% and 1.4% for TC and TG respectively. Venous blood sample analysis was performed at the hematology laboratory of the Universitair Ziekenhuis Brussel (Brussels, Belgium), an ISO 15189 accredited laboratory for clinical biology. TC concentration was classified as: ‘normal’ when TC < 5.18 mmol/L; ‘borderline’ when 5.18 mmol/L ≤ TC < 6.22 mmol/L and ‘high’ when TC ≥ 6.22 mmol/L. TG concentration was considered as: ‘normal’ when TG < 1.69 mmol/L, ‘borderline high’ when 1.69 mmol/L ≤ TG < 2.26 mmol/L; ‘high’ when 2.26 mmol/L ≤ TG < 5.64 mmol/L and ‘very high’ when TG ≥ 5.64 mmol/L (3).
In order to assess differences in daily caloric and nutritional intake all participants completed a self-administered questionnaire containing a personal three-day food diary based on the National Health Survey (a validated instrument used to estimate health-related issues in the Belgian population every 5 years (15)), that started at the day of venous blood collection. Daily nutritional intake was calculated using an online diet planner (Nubel vzw, Brussels, Belgium) supported by the Federal Public Service for Health, Food Chain Safety and Environment (16).
Statistical analysis
The control range of the Accutrend® Plus has not changed compared to the older Accutrend devices (Accutrend GC, Accutrend GCT). Values outside the control range set up by the manufacturer (3.88-7.76 mmol/L for TC, and 0.80-6.86 mmol/L for TG) were excluded for statistical analysis. Normality of all data was verified using Kolmogorov-Smirnov goodness of fit tests.
The day-to-day reproducibility of the Accutrend® Plus system was assessed by computing differences between two consecutive assessments (24 h and 48 h following baseline) using paired samples t-tests and by calculating intra-class correlation coefficients (ICC, model 2.1) (17). The standard error of measurement (SEM = σ x √1-ICC, with σ = standard deviation of the test and the retest capillary values) and the smallest detectable change (SDC = 1.96 x √2 x SEM) were calculated (18). To verify that test-retest results obtained by the Accutrend® Plus were unaffected by the diet of the volunteers, macro-nutrient intake obtained by 24h food diaries preceding both test and retest were compared by paired samples t-tests or Wilcoxon signed rank tests.
The accuracy of the Accutrend® Plus for measuring TC and TG was determined by comparing the results with those of the simultaneously sampled venous blood results using paired samples t-tests and Pearson’s correlation coefficients. The agreement between capillary Accutrend and reference method was assessed using Passing and Bablok regression and Bland and Altman analysis (19,20). A difference between methods not exceeding 8.9% for TC and 15% for TG, as stated by NCEP recommendations, was regarded as clinically acceptable (3).
Additionally the classification of the participants according to the NCEP for TC and TG was compared between both methods using Fisher’s exact tests and weighted kappa statistics (κw). For the interpretation of the kappa values the following criteria were applied: κ > 0.80 “excellent agreement”, 0.80 ≤ κ < 0.60 “substantial agreement”; 0.40 ≤ κ ≤ 0.60 “moderate agreement”, and κ < 0.40 “poor to fair agreement” (21).
Data were analyzed by using IBM® SPSS® Statistics version 20 (2011, SPSS Inc., New York, USA) or Medcalc version 12 (Medcalc Software, Mariakerke, Belgium). Group data are expressed as mean ± SD and statistical significance was set at P< 0.05.
Results
Out of the 61 measurements obtained by the Accutrend® Plus, one value for TC level (above the higher limit) and 13 values for TG level (11 below the lower limit and 2 above the higher limit) fell outside the measurement range determined by the manufacturer.
Reproducibility of the Accutrend® Plus
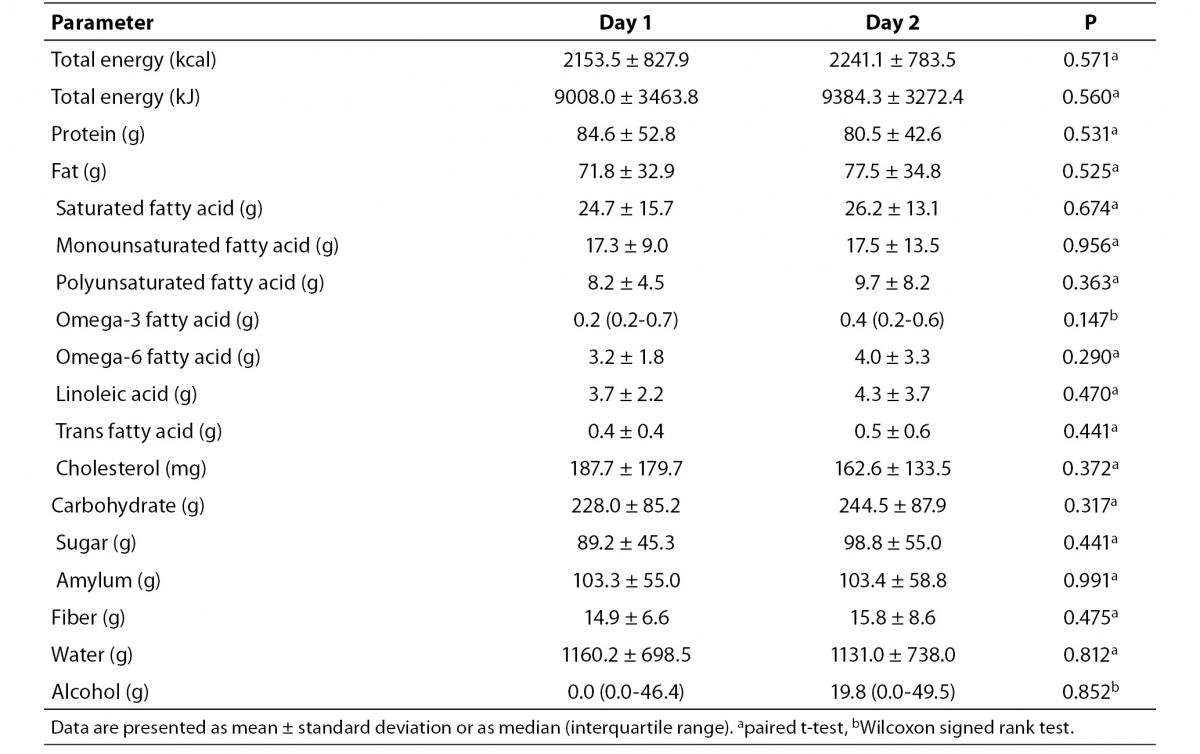
No significant differences in calorie or nutrient intake were found between the first and second day of observation (Table 1).
Table 1. Daily caloric and nutrient intake of the volunteers before capillary Accutrend® Plus test and retest assessments.
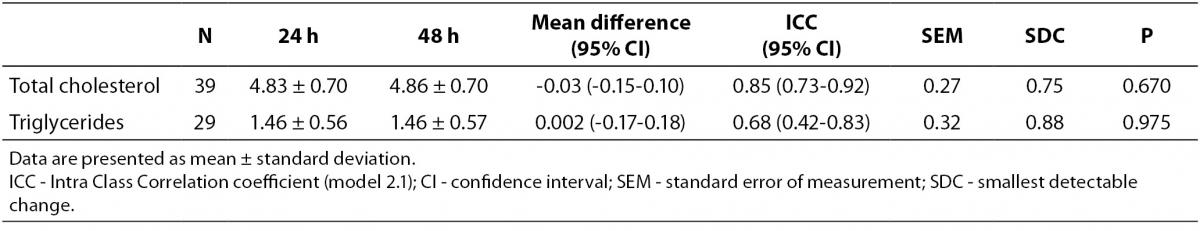
The day-to-day reproducibility of the Accutrend® Plus proved to be high for TC concentration (ICC = 0.85, P < 0.001), but moderate for TG concentration (ICC = 0.68, P < 0.001). No significant differences in mean lipid concentration between both assessments were found (Table 2). At a 24 h interval, smallest detectable changes of 0.75 mmol/L for TC concentration and 0.88 mmol/L for TG concentration were found.
Table 2. Measurement reproducibility of capillary lipid concentrations (mmol/L) at 24h interval obtained by Accutrend® Plus.
Accuracy of the Accutrend® Plus
Table 3 summarizes the results for TC and TG concentration obtained by Accutend® Plus compared with the criterion method.
Table 3. Comparison between venous and capillary lipid concentration (mmol/L).
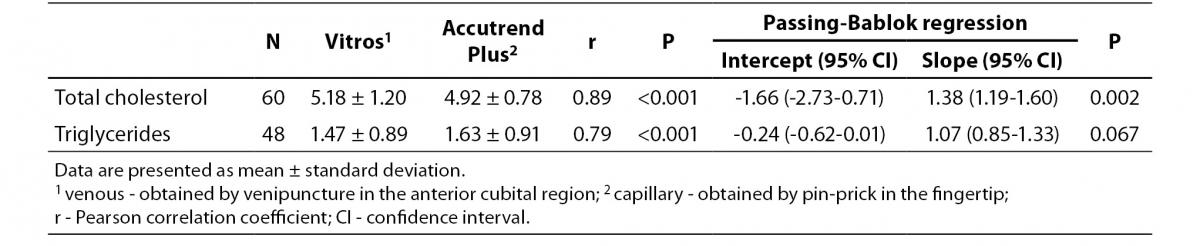
Despite a good correlation for the measurement of TC (r = 0.89, P < 0.001) between methods, the Accutrend® Plus significantly (P = 0.002) underestimated TC concentration. Passing-Bablok regression indicated a systematic (constant and proportional) difference between methods (Figure 1A). For TC, the estimated bias was 0.26 mmol/L (95% CI 0.10 to 0.42) and 95% limits of agreement were (-0.95, 1.47 mmol/L) (Figure 1B).
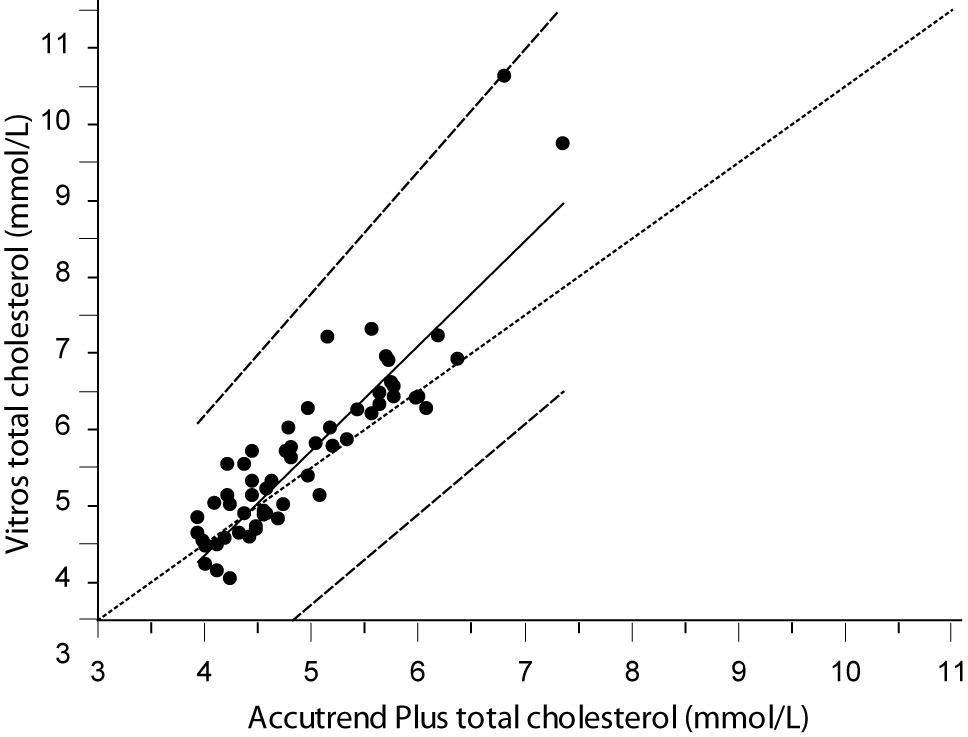
Figure 1A. Passing-Bablok regression plot for total cholesterol determined on Vitros® 5.1 FS and Accutrend® Plus, N = 60; concentration range 3.88–7.77 mmol/L; Pearson correlation coefficient r = 0.89, P < 0.001.
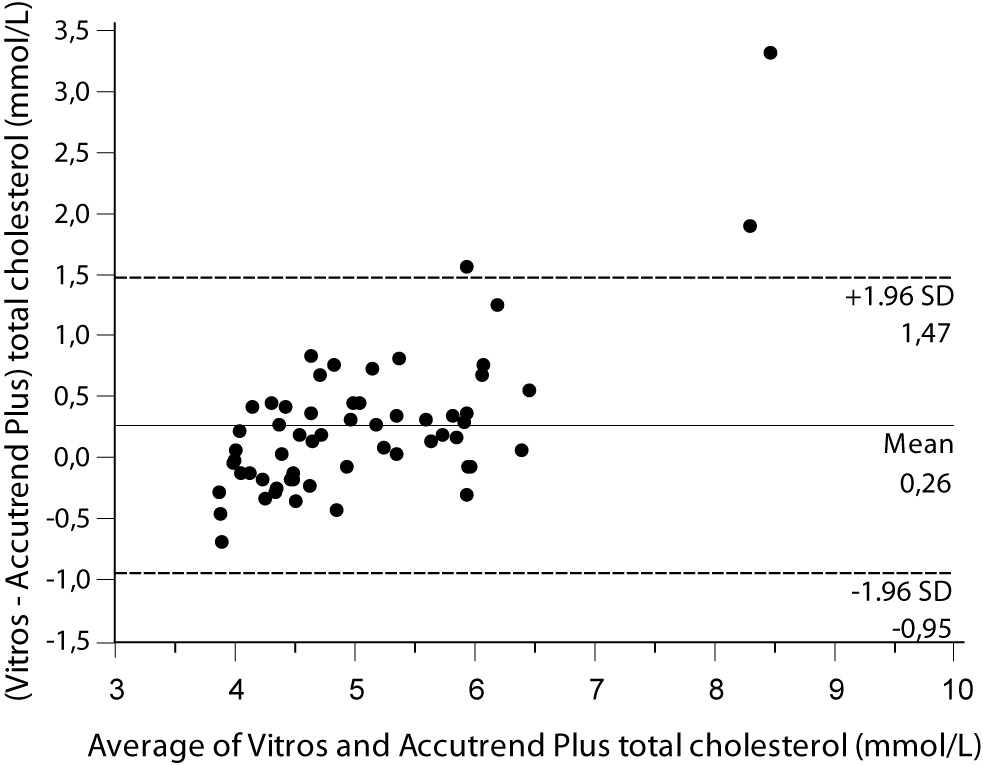
Figure 1B. Bland and Altman plot for the difference between Vitros® 5.1 FS and Accutrend® Plus total cholesterol concentration (mmol/L).
For the determination of TG a fair correlation (r = 0.79, P < 0.001) between methods was found without significant difference (P = 0.067). Passing and Bablok regression analysis indicated good agreement between methods, without systematic and proportional difference between methods (Figure 2A). Although the small mean difference of -0.16 mmol/L (95% CI -0.32 to 0.01) was not significant, 95% limits of agreement of (-1.29, 0.98 mmol/L) were wide, reflecting substantial variability of individual differences between methods (Figure 2B).
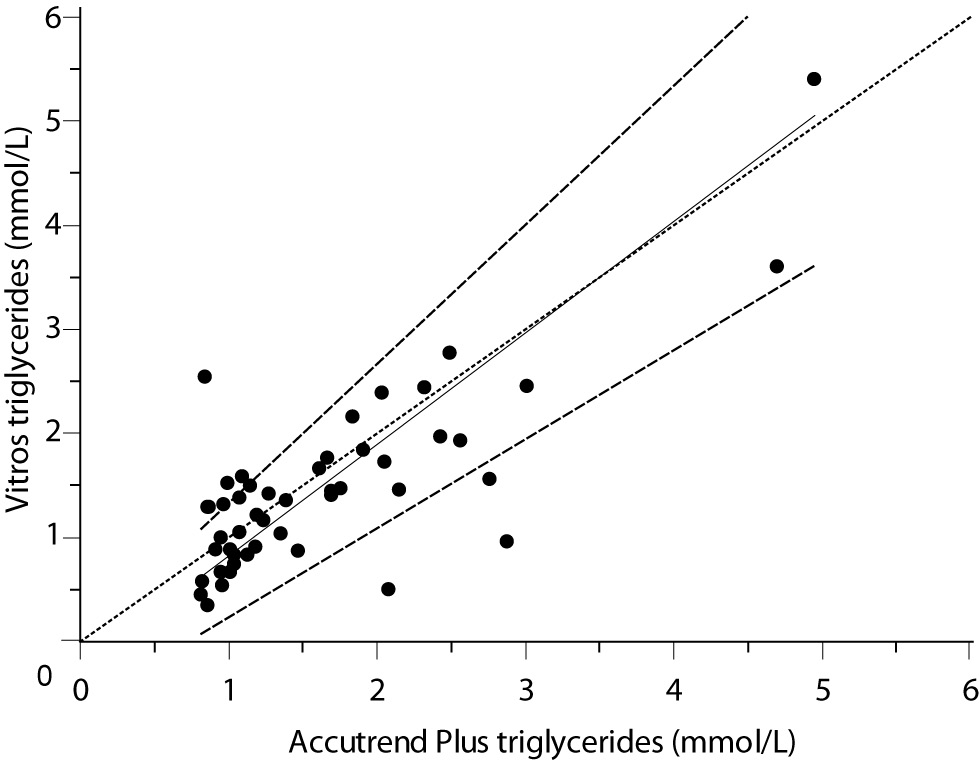
Figure 2A. Passing-Bablok regression plot for triglycerides determined on Vitros® 5.1 FS and Accutrend® Plus, N = 48; concentration range 0.79–6.77 mmol/L; Pearson correlation coefficient r = 0.79, P < 0.001.
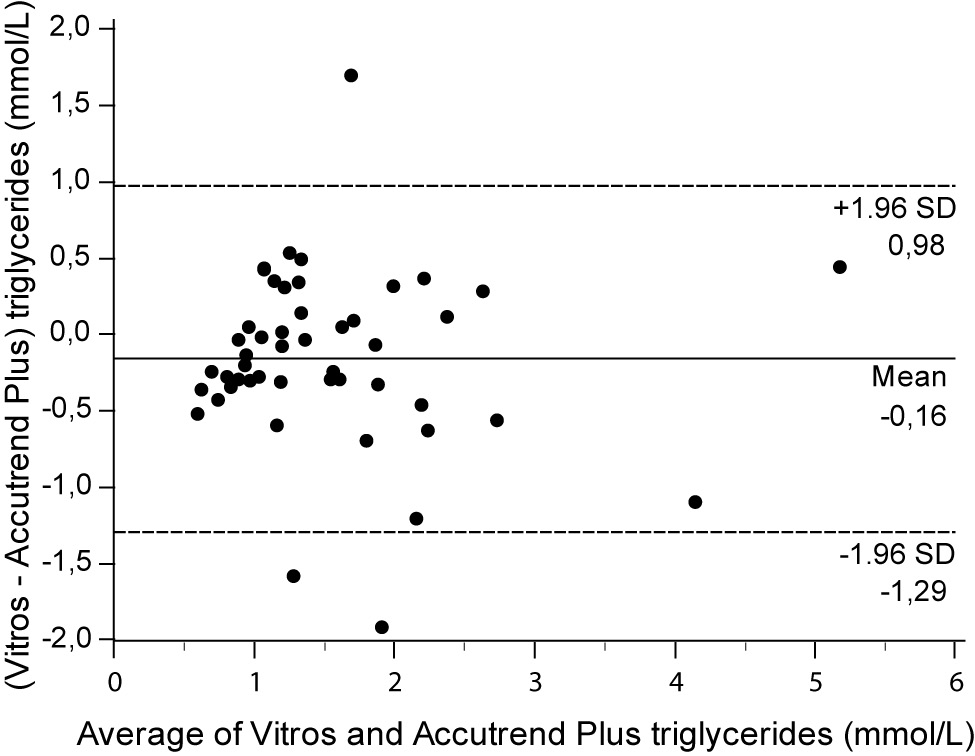
Figure 2B. Bland and Altman plot for the difference between Vitros® 5.1 FS and Accutrend® Plus triglyceride concentration (mmol/L).
Concordance of the Accutrend® Plus
The classification of individuals according to the NCEP based on lipid profile obtained by both methods is shown in Table 4.
Table 4. Concordance between Accutrend® Plus and Vitros® 5.1 FS for classifying 61 subjects following total cholesterol and triglyceride levels according to the NCEP guidelines.
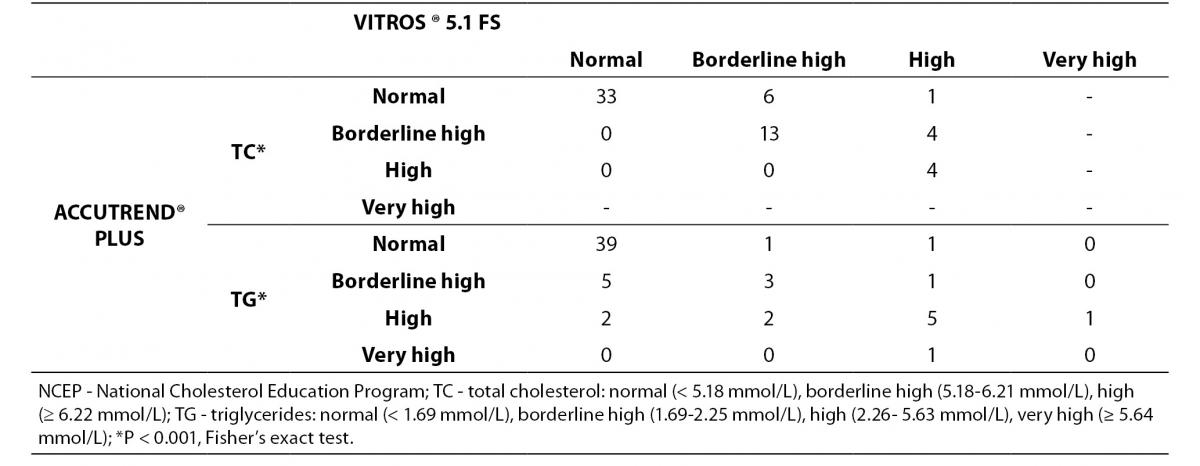
For TC level, the percentage of subjects within ‘risk’-groups did not differ between methods (P < 0.001, Fisher’s exact test). A substantial agreement was found (κw = 0.67). Eighty-two percent of the volunteers were classified in the same group by the Accutrend® Plus and the reference method, while 18% was classified in a ‘lower’ risk group by Accutrend® Plus.
For TG level, the percentage of subjects within ‘risk’-groups did not differ between methods (P < 0.001, Fisher’s exact test). A moderate agreement was found (κw = 0.50). Seventy-seven percent of the volunteers were equally classified using values obtained by both methods. Based on the Accutrend® Plus, 7% was classified in a group with ‘less’ risk, while the remaining 16% was classified in a group at ‘higher’ risk compared to the reference method.
Discussion
Today the Accutrend® Plus system is used by physicians, nutritionists, patients as well as researchers in screening and diagnosis of hyperlipidemia; or to monitor the effects of diet or drug therapy on lipid profile (22,23). Subjects that are at increased CVD risk may benefit from a user-friendly system to monitor the effects of treatment thus stimulating personal health management. In this context, it has recently been shown that self-monitoring of blood lipids in patients with severe hypertriglyceridemia favors treatment compliance (24). Most of the previous validation studies involving the Accutrend system have been carried out in laboratory circumstances. However this portable device has been designed for home or ambulatory use. This study is the first to validate the Accutrend® Plus outside a laboratory setting.
In the present study, the day-to-day reproducibility of the Accutrend® Plus proved to be high for the measurement of TC (ICC = 0.85) and moderate for TG (ICC = 0.68). Since the measurement of lipid concentration was carried out after a fasting period of at least 8 hours without differences in nutrient intake 24h before sampling, one might expect similar values at a 24 hour interval. It is generally accepted that an intra-individual biological variability of respectively 3.9% and 14.0% for TC and TG concentration is to be considered as normal (25). Taking this natural variability into account, the day-to-day reproducibility for lipid concentration by Accutrend® Plus remained within the limits of biological variability. However, day-to-day differences less than 0.75 mmol/L (29 mg/dL) for TC and 0.88 mmol/L (78 mg/dL) for TG are to be considered non-significant. It is therefore suggested that the values mentioned above represent the smallest detectable changes during follow-up using the Accutrend® Plus system.
The results of our study show that capillary blood lipids are well correlated (r-values ≥ 0.80, P < 0.001) with their venous analogues. Bland-Altman analysis showed that, on average, Accutrend® Plus tended to underestimate venous TC by 0.26 mmol/L. This is in agreement with previous findings (7,26). The agreement between methods fell outside clinically acceptable limits of ≤ 8.9%, as stated by NCEP recommendations for cholesterol measurement. Further research is required to determine the exact reasons for the consistence differences in TC concentration. In the present study, Accutrend® Plus overestimated venous TG concentration by 0.16 mmol/L. This overestimation in capillary blood has been reported previously (5,10,26,27). Since lipids are being consumed by the cells, fingerstick capillary TG concentration should be higher than venous TG concentration. Therefore, overestimation of TG concentration by the Accutrend® Plus in the present study might be explained by different hemodynamic conditions in the capillary bed. However, the level of agreement between capillary and venous TG resulted in clinically important discrepancies of ± 75% (± 1.14 mmol/L), and appeared to worsen with increasing values. This variability should not be ignored when developing a protocol for triglyceride screening.
Based on the ‘cardiovascular risk’ classification of subjects according to lipid concentration, an acceptable concordance between Accutrend® Plus and the laboratory reference was found. However, the former tended to underestimate CVD risk based on TC concentration, while mainly overestimating CVD risk based on TG level.
All results considered, the present study suggests that day-to-day reproducibility of the Accutrend® Plus device for TC and TG is not optimal and lacks accuracy when compared to the reference laboratory method. The concordance between both methods for classifying subjects according to the NCEP is not adequate. Accutrend® Plus device should not be interchangeably used as a substitution for the standard laboratory methods in the diagnosis of hyperlipidemia.
This study did not evaluate potential influence of bilirubin, hemoglobin, free glycerol or ascorbic acid on cholesterol and/or triglyceride concentration using an enzymatic oxidase/peroxidase assay as is the case with the Accutrend® Plus. Therefore the interference of the above mentioned biomolecules with Accutrend® Plus accuracy cannot be excluded (28,29). However the volunteers in the present study did not follow any specific diet, nor used vitamin supplements or medications, thereby reducing the risk of erroneous measurements.
Conclusion
Accutrend® Plus TC and TG concentration correlates satisfactorily with its laboratory analogue. However, higher precision for the determination of lipid profile is warranted, especially for the measurement of TG concentration. Although the Accutrend® Plus system may provide useful information for the referral of persons at cardiovascular risk, this device should not be used as a substitution for the laboratory methods in the diagnosis of hyperlipidemia. Given its day-to-day reproducibility, the Accutrend® Plus might be used as a system for self-monitoring. Under constant diet circumstances, fluctuations of 0.75 mmol/L (29 mg/dL) for TC and 0.88 mmol/L (78 mg/dL) for TG are to be considered as non-significant.
Acknowledgements
The authors wish to thank Dr. E. Provyn (MD) for her technical assistance.