Introduction
Prothrombin time (PT) is the most common coagulation test performed in the clinical laboratory. PT is used to detect abnormalities in the extrinsic coagulation pathway. PT measurement is critical when thrombotic patients are on oral anticoagulant therapy. However, it can be difficult to compare PT test results from different laboratories (1); standardization is essential. Thromboplastin, the principal reagent of the PT assay, is commercially available in different forms. To achieve the required standardization, all thromboplastin preparations should be calibrated using the International Sensitivity Index (ISI) and PT results should be presented in International Normalized Ratio (INR) units (2). The WHO Expert Committee on Biological Standardization has decreed that standardization requires a comparison of results yielded by the test thromboplastin with those afforded when a reference thromboplastin is employed (2,3). However, it is clear that standardization is not universally performed (4-7).
In Turkey, public procurement law requires that the lowest bid be accepted when equipment or reagents are ordered. Thus, the choice of a coagulometer is price-dependent, even though the accuracy and reliability of INR measurement is essential. The Steelex M600H (Steelex Scientific Instrument Company, Beijing, China), approved for use in our laboratory because the device is inexpensive, is a new coagulometer that measures PT and INR.
The aim of the present study was to validate INR results obtained using the Steelex M600H coagulometer and Steelex reagents (the PT kit) by comparing such data with the results yielded by a Teco Coatron A4 coagulometer (Teco Medical Instruments GmbH, Neufahrn, Germany) employing a Pacific Hemostasis test reagent (Thromboplastin-DS, Fisher Diagnostics, VA, USA). The latter test is standard in the clinical laboratory.
Materials and methods
The present study was conducted in the period from June to July 2011 in the clinical laboratory of the Şevket Yılmaz Research and Education Hospital. The study was approved by our institutional Ethics Committee and all participants gave written informed consent. All procedures were in accordance with the Second Declaration of Helsinki.
PT and INR determination methods
As a reference method, plasma PT was analyzed in an automated manner using a Teco Coatron A4 coagulator. The PT of citrated plasma was determined photometrically employing a high-resolution four-channel optic system (400 nm) and a suspension of rabbit brain thromboplastin (Thromboplastin-DS) prepared in calcium chloride solution. The instrument was calibrated employing calibration reference plasmas with manufacturer-assigned INR values (TECal N calibration plasma cat. no. P800-010, Teco GmbH, Germany) (8). The thromboplastin ISI value assigned by the manufacturer was 1.03. This is the method by which PT is routinely measured, in INR, in our hospital.
Steelex M600H
PT coagulation time was measured employing a new fully automated Steelex M600H coagulometer and Steelex test reagents, and a freeze-dried extract of rabbit brain thromboplastin (product no. SS00110001; lot no. STG20101-LG4) prepared in a buffer containing calcium chloride. The ISI assigned to this preparation by the manufacturer was 1.18. In the Steelex system, light passing through a medium in which fibrinogen has been converted to fibrin is absorbed by the fibrin stands. The instrument identifies a coagulation endpoint by measuring the change in optical density at 470 nm, and this information is processed, using inbuilt software, to determine a clot point. The instrument was calibrated employing calibration reference plasmas with manufacturer-assigned INR values (Unicalibrator cat. no. 00675 Diagnostica Stago, Inc., France) (8). The INR is calculated and automatically displayed by the instruments from the prothrombin time using the formula (3):
INR = (PTsample/PTnormal)ISI
The coefficients of variation of the regression line slopes of calibration curves of both instruments were less than 3%, in accordance with the WHO requirements (9). All INRs were calculated using a local prothrombin time (PT); this was the mean normal prothrombin time (MNPT) obtained using 20 fresh normal samples from healthy individuals (10).
Analytical precision of PT and INR determinations
Before specimen analysis, we performed two-level quality-control (QC) tests using materials supplied by either manufacturer (Steelex ANCP, catalog no. SS005711001 and NCP, catalog no. SS000500007; Pacific Hemostasis INR Control Plasma catalog nos. 100595 and 100596). Between-day differences in QC data were determined via analysis of duplicates on each of 20 successive days. Within-day precision was calculated by conducting 20 replicate analyses of the QC materials in a single run. Between-day precision is a measure of random analytical error (11).
Patients and blood sampling
Venous blood samples were obtained from 90 patients for whom PT (INR) tests were scheduled as part of routine preoperative check-up (N = 14) or for monitoring of oral anticoagulant therapy (OAT) (N = 76). Patients with atrial fibrillation and/or a prosthetic heart valve, and those prescribed long-term OAT were accepted to the study. Of all patients, 35 were in their first 3 months of treatment (the dose-adjustment phase) whereas 41 were in a later treatment stage (the maintenance phase). Of all patients, the INR values of 48 were 1-1.09 units, those of 27 2-2.7 units, and those of 15 3-4.9 units. Hence, all possible anticoagulation phases (pretreatment, dose-adjustment, and steady-state) were included.
Blood samples (each 1.8 mL) were collected into citrate coagulation tubes (Vacuette; Greiner Labortechnik GmbH, Krems- münster, Austria; catalog no. 454322 9NC) each containing 0.2 mL 3.2% (w/v) sodium citrate (0.109 M). Both the WHO and the NCCLS state that 3.2% (w/v) citrate is the appropriate anticoagulant level when coagulation is to be tested (2,12). Plasma was obtained via centrifugation for 15 min at 1,500 x g. All samples were assayed using the two systems within 1 hour of blood collection.
Statistical analysis
Data were evaluated using SPSS version 13.0 (SPSS Inc., Chicago, IL, USA) and Analyse-It version 2.04 (Analyse-It Software, Leeds, UK). Means, standard deviations, and coefficients of variation were calculated.(13-15).
Results
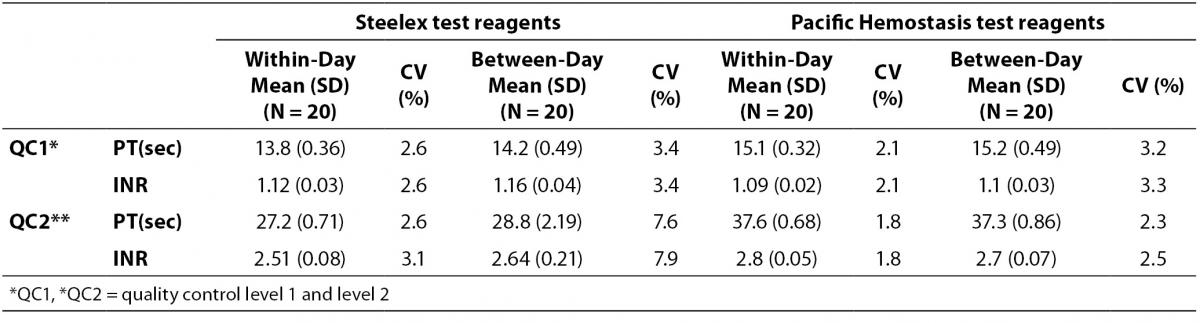
The coefficients of variation (CVs) of within- and between-day QC data are presented in Table 1.
Table 1: Within-day imprecision data and between-day imprecision data for Steelex test reagent on Steelex M600H coagulometer and Pacific Hemostasis test reagents on Teco Coatron A4 coagulometer.
Passing and Bablok regression analysis yielded an intercept of 0.12 units (95% confidence interval (CI) = -0.02-0.21) and a slope of 0.85 (95% CI = 0.79-0.91), suggesting that, a proportional difference existed between the two methods (Figure 1) (14). The cumulative sum linearity test (CUSUM test) revealed significant deviation from linearity (P < 0.01) (14).
The Bland–Altman difference plot showed that the mean bias was -0.156 units and the 95% limits of agreement were - 0.912 to 0.600 when the Steelex and Pacific test data were compared (Figure 2). The bias was lower in the sub-therapeutic range (INR < 2.0) and higher in the therapeutic range (INR = 2.0-4.5) (Figure 1).
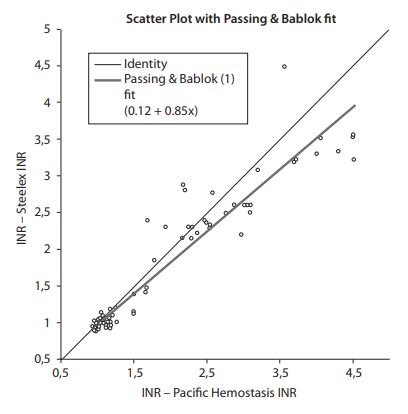
Figure 1. Passing-Bablok regression analysis for the Steelex INR results vs. laboratory (Pacific) INR results. The solid line indicates the regression line.
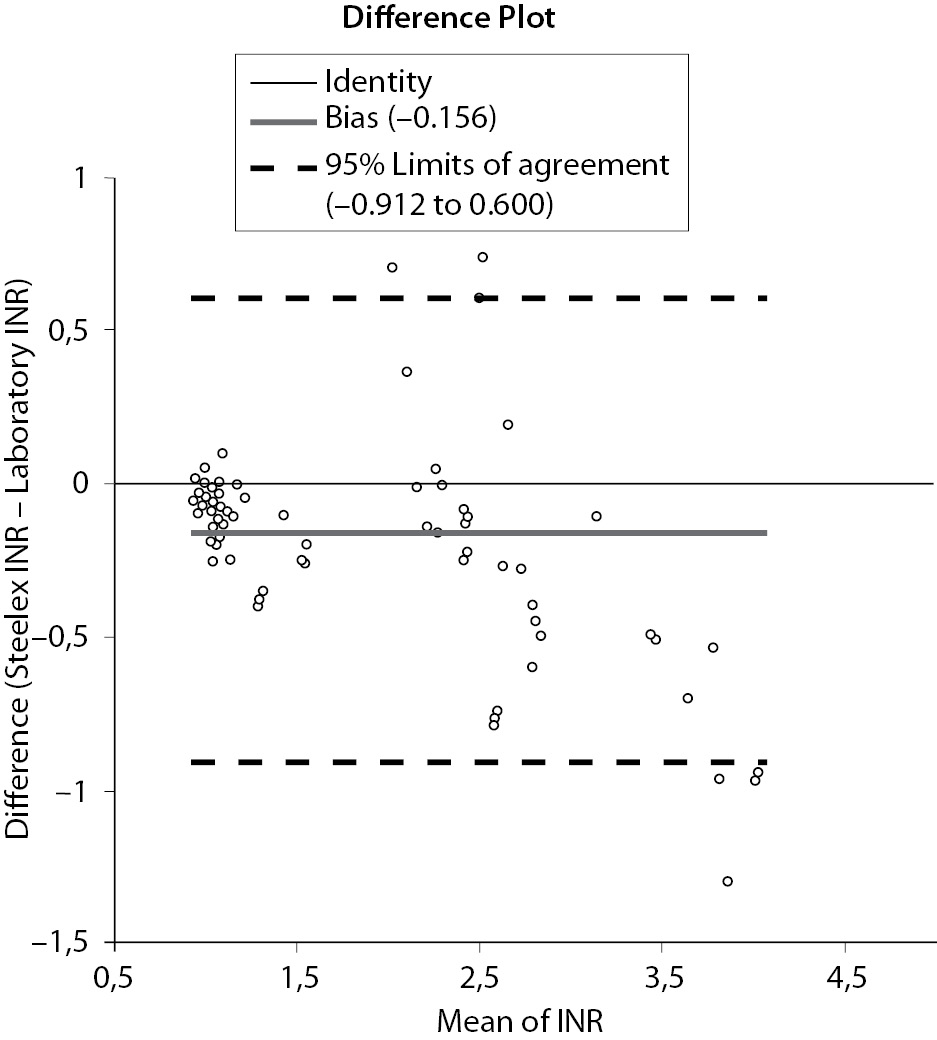
Figure 2. Bland-Altman plot analysis between compaired methods.
Discussion
Extensive international collaboration has allowed laboratory INR measurement to become standardized worldwide; this is an essential feature of quality control (16,17). To ensure test result accuracy, clinical laboratories are required to conduct internal quality control tests and to participate in external quality assurance (EQA) networks. Our laboratory is a member of the national external quality assessment scheme (KBUDEK, Istanbul, Turkey) that evaluates coagulation test data (PT/INR; and assays of APTT and fibrinogen). We routinely employ Pacific Hemostasis test reagents. At the time of the present study, the average values of the Standard Deviation Index (SDI; Mean minus Peer Group Mean/SD of Peer Group Mean) obtained from 134 laboratories using Pacific test reagents were 0% for an INR of 1.04 and minus 0.15% for an INR of 1.95. The SDI is a parameter for evaluating bias relative to the consensus group. It provides a good measure of accuracy because each laboratory’s results are compared to the mean value for all laboratories, which is assumed to be the true value.
We consider that the Pacific system is a suitable standard for use in validation studies as this method yielded acceptable quality control data during our study period and employs highly sensitive human thromboplastin (ISI = 1.03), as recommended by the College of American Pathologists (12).
Within-run imprecision was satisfactory for both systems (CV ≤ 3.1%). The Steelex system had a higher between-run CV than did the Pacific method, explained by the fact that use of reagents of higher ISI is associated with greater interlaboratory INR CVs (18). The level of between-run imprecision using the Steelex system (Level 2; CV = 7.9%) was unacceptable; the value should be less than 5% when an INR assay is performed (19).
Monitoring of PT via calculation of INRs is important for patients on oral anticoagulation therapy; appropriate doses can thus be prescribed. Accurate INR estimation is crucial (20). Global harmonization of INR results, and agreement on the therapeutic ranges associated with varying clinical indications, is important (21). Many factors influence INR values; these include the levels of various coagulation factors present and their interaction with thromboplastin reagents differing in composition and sensitivity to the actions of such factors (22). It can be difficult to obtain accurate and precise INR measurements. Both PT and INR data should be identical regardless of the reagents, instrument, or test method used. However, agreement among results yielded by many commercial INR methods is poor. Such variations may compromise patient care (1,7).
In our present work; Passing and Bablok regression analysis yielded the appropriate y-intercept value of zero but the slope of the regression line did not approximate unity, suggesting that, in addition to the presence of a small constant bias, a proportional difference existed between the two methods (14). Our results are in agreement with previous findings of poor agreement among data obtained using different methods to calculate PT and INR (7,23). The variation noted in the present work may be attributable to differences between any or all of methodology, the coagulometers used, and thromboplastin source. Many recent reports have shown that coagulometer choice has a marked and unpredictable effect on INR value (24). The precision of PT testing tends to be greater when ISI is lower (24) but end-point reliability is also affected by reagent quality (24).
Quality control is essential; it is recommended that analytical imprecision be less than or equal to half of intra-individual biological variation (25-27). Ricos et al. (28) found intra-individual INR variation of 4% and inter-individual variation of 6.8%. Kjeldsen (29) recorded in-treatment intra-individual INR variation of 10.1%. Via computer simulation of serial INR measurements within the generally accepted therapeutic range (INR 2.0-3.0), the cited author concluded that analytical imprecision should be less than 5% and analytical bias less than ± 0.2 INR units (29). In the present study, the overall analytical bias was indeed less than ± 0.2 INR units, but, in the therapeutic range, the bias was greater than ± 0.2 INR units, thus significantly higher than current recommendations (28,29). It is evident that ISI strongly influences INR inter-laboratory variability (30). Although the ISI assigned by the manufacturer of the Steelex M600H coagulometer was relatively low (1.18), a major limitation of our study is that local ISI calibration using WHO-certified plasma was not performed. Incorrect assignment of ISI values by manufacturers may cause among-method differences in test results.
In particular, we found that INR data obtained using either the Steelex PT or Pacific reagents were in acceptable agreement in patients with INR values close to 1, but variance within the therapeutic range (INR 2.0-4.5) was unacceptable, with an analytical bias over 0.20 INR units (19,29) being evident in twenty eight out of 90 patients. Similarly, Horsti et al. (7) found that INR values obtained using different methods were very similar when such values were close to unity but marked variations were evident at higher INR values. This is unacceptable, because bias of this magnitude may result in prescription of incorrect amounts of anticoagulation agents (9).
Conclusion
In conclusion, reliable PT, INR test data are important for proper management of patients on OAT. Our results indicate that results obtained from Steelex M600H coagulometer using Steelex reagents kit are not interchangeable with Teco Coatron A4 coagulation coagulometer using Pacific Hemostasis reagent kit, in the therapeutic range.
Acknowledgments
We did not receive any funding for this study.