Introduction
Total quality in laboratory diagnostics is a multifaceted and challenging enterprise, which entails standardization and monitoring of a number of activities throughout the total testing process (1). Although several lines of evidence now attest that most laboratory errors emerge from manually intensive steps of the preanalytical phase (2,3), a variety of analytical errors may still occur in the analytical phase, which basically entail random errors during measurements, inappropriate calibration of methods, volume displacement, matrix effects, instrument carryover as well as analytical interference(s) (4). In a recent survey, published by Plebani and Carraro in 2007, problems in the analytical phase were responsible for nearly 15% of all diagnostic mistakes (5). Analytical inaccuracy not recognized (e.g., release of results despite unacceptable internal quality control data due to problems in calibration-verification procedure) and instrument-caused random errors (e.g., pipetting problems, presence of interfering substances or short sampling) were found to be the most frequent mistakes in this phase of total testing process. It is also noteworthy that the vast majority of these errors (i.e. approx 90%) was considered as preventable, thus reinforcing the notion that analytical errors are nothing but unlikely and additional efforts should be placed for preventing their occurrence. The aim of this review is to provide an overview about the interference of medical contrast media on laboratory testing.
Analytical interference
Some definitions have been provided for the concept of “analytical interference”, which basically describe the same phenomenon under different perspectives. These include “the cause of clinically significant bias in the measured analyte concentration due to the effect of another component or property of the sample” (6), “the systematic error of measurement caused by a sample component, which does not, by itself, produce a signal in the measuring system” (7), “the effect of a substance present in an analytical system, which causes deviation of the measured value from the true value” (8), and again “a substance or process that falsely alter an assay result” (9). Regardless of different terms used for defining an identical concept, a reliable synthesis has been provided by the Clinical and Laboratory Standards Institute (CLSI), wherein a bias in measurement may be due to lack of specificity of detection system, suppression of an indicator reaction, inhibition (or activation) of the measured analyte, along with other cause of specimen-dependent bias (6). The interfering substance is not necessarily a source of the measuring system signal, but may cause either increase or decrease of its indicated value.
The interfering substances are hence basically classified in (i) endogenous, when are present or originate from biological elements normally found in patient samples, thus including metabolic products, cell-free haemoglobin (10,11), hyperbilirubinemia (11), hyperlipidaemia (11,12), proteins (especially paraproteins) (13), autoantibodies or heterophilic antibodies (14), excessive analyte concentration and cross-reacting substances; or (ii) exogenous, when these compounds are not normally found in the specimens, and hence include different types of drugs and intravenous therapeutics, chemicals, natural products, component of collection system (i.e. parts of vial, gel separator or tube stopper) (15), additives such as anticoagulants (e.g., EDTA, heparin, buffered sodium citrate) or procoagulants (e.g., thrombin or other enzyme added to accelerate sample clotting), preservatives added for maintaining sample quality (e.g., sodium azide, penicillin G, streptomycin and amphotericin B, bestatin, leupeptin and aprotinin) (16), contaminants inadvertently introduced during sample handling (17), and products of carryover contamination (18). The interference on analytical measurements may be complex and even multifaceted, thus involving different mechanisms, including (i) immunochemical interference, when the compound or its metabolites cross-react with the measured analyte; (ii) reaction interference, when the compound or its metabolites catalyze or inhibit some step of the chemical or immunochemical reaction; (iii) photometric interference, when the compound or its metabolites have absorption (or emission) peaks that overlap with those of the measured chromogen (9); as well as (iv) dilutional effects due to variable amounts of infusion fluid that may accompany the administration of diagnostic agents. Regardless of the underlining causes, this article is specifically addressed to provide an overview on the interference of medical diagnostic media on results of laboratory testing.
Medical contrast media
Medical contrast media (or contrast agents) include a category of compounds that are conventionally used to enhance the contrast of structures or fluids within the body during medical imaging. Several types of agents have been developed for use in medical imaging, which can be roughly be classified according to the imaging modalities where they are used. Organic iodine molecules (e.g., iohexol, iodixanol and ioversol) and barium sulphate are the most common types of contrast media for enhancing x-ray-based imaging methods (19), whereas gadolinium contrast agents (ionic, neutral, albumin-bound or polymeric) are typically used in magnetic resonance imaging (MRI) (20).
The chemical characteristics of these agents have substantially changed over time. The so called first-generation ionic contrast media are substantially monomers composed by a single benzene ring that ionize in solution with an oxidation state of -1. They are hence characterized by up to 7-fold greater osmolality than plasma and a remarkable risk of causing contrast-induced nephropathy (21). In order to prevent this life-threatening condition, a new generation of non-ionic contrast media has been developed. These basically include non-ionic monomers and non-ionic dimers, which dissolve in water but do not dissociate. Therefore, generating a fewer number of particles in solution, they are characterized by an osmolality that is very similar to that of blood (i.e. up to 2-3 fold that of blood for low-osmolar media, and the same as blood for iso-osmolar media), but also by a greater viscosity (21).
Interference from organic iodine molecules
Although some evidences have been published about the potential analytical interference of contrast media in laboratory diagnostics, it is important to mention here that the problems caused by these compounds may also impact on sample quality and integrity. Interestingly, Spiritus et al. (22) first observed that the presence of these high-density molecules may increase the density of plasma or serum to such an extent to exceed that of gel separators, thus interfering with correct formation of barrier between sample matrix and cells in the blood tube, so causing the gel to partially or completely float at the top of serum (or plasma). Identical observations were more recently reported by Kaleta et al. (23), who identified two cases of migration of gel separator above serum in patients receiving iodinated contrast media during coronary angiography and percutaneous intervention, and by Daves et al. (24), who reported the case of unusual positioning of gel separator, which migrated at the topmost layer in the serum sample of a patient who received a tri-iodinated non-ionic water-soluble contrast dye during a revascularization procedure for acute myocardial infarction.
As more specifically regards analytical interference, Lin et al. (25) reported a significant (positive) bias in results of troponin I (TnI) measured with one assay in the presence of iodinated contrast media. In a first in vivo part of this study involving 45 subjects undergoing coronary angiography with iopromide, the concentration of TnI measured with Opus Magnum cTnI immunoassay system (Behring Diagnostics) was lower than the diagnostic threshold (0.5 ng/mL) in all samples drawn before the procedure, but increased over this threshold in 38 samples (rate 0.84) collected 5 min after the procedure, and in 4 samples (rate 0.09) collected 30 min afterwards. The concentration of TnI returned to values lower than the diagnostic cut-off of the assay 1 h after the end of the procedure. In a second experiment, the concentration of TnI was compared using Opus Magnum and ACCESS AccuTnI (Beckman Coulter) in samples taken from 25 patients undergoing coronary angiography with iopromide. The values obtained with Opus Magnum cTnI increased again over the diagnostic threshold of the assay in 21 patients (rate 0.81) after 5 and 30 min after the procedure, whereas those of Access AccuTnI always remained lower than the cut-off of the method (i.e. 0.15 ng/mL). When as many as 12 different iodinated contrast media were spiked to serum samples, a positive bias was always recorded using Opus Magnum cTnI, whereas a significant increase of troponin values was only seen with one contrast medium (i.e. poppy-seed oil) using Access AccuTnI. Interestingly, the magnitude of bias in TnI measurements on Opus Magnum cTnI was directly correlated with the concentration of contrast media.
Bossuyt et al. (26) first described a potential interference in capillary zone electrophoresis in serum samples of patients receiving intravascular radio-opaque agents. In all electropherograms of these patients, an abnormal peak (“spike”) was observed in the alpha-2-globulin fraction, 2-4 h after injection of contrast media. The peak was at the anodal side of alpha-2-globulin fraction in the presence of amidotrizoate, at centre of alpha-2 fraction in the presence of ioxitalamate, and at cathodal side of alpha-2 fraction with iohexol. In all circumstances the peak could not be found on standard agarose electrophoresis. The interference was then attributed to absorbance at 214 nm of both proteins and iodinated contrast media, since these compounds absorb the light in the far ultraviolet and peak between 237 and 244 nm. Arranz-Peña et al. (27) also investigated the effect of 12 opaque contrast media on serum capillary zone electrophoresis, by adding each compound to a control serum to achieve the expected concentration after bolus injection for radiographic examination (i.e. 7.5 g/L). Interesting, each iodinated contrast media caused the appearance of an abnormal peak in the alpha-2-zone of the electropherogram. All peaks had the same form and location as the extra peak found in electropherograms of patients who are infused with contrast agents. These findings were confirmed in other following investigations (28-30).
Finally, Potter et al. (31) reported that certain contrast agents may interfere with paper chromatography and paper electrophoresis of organic acids and ultraviolet-absorbing compounds such as purine bases and their derivatives, as well as in other methods involving ultraviolet absorption.
Interference from gadolinium contrast agents
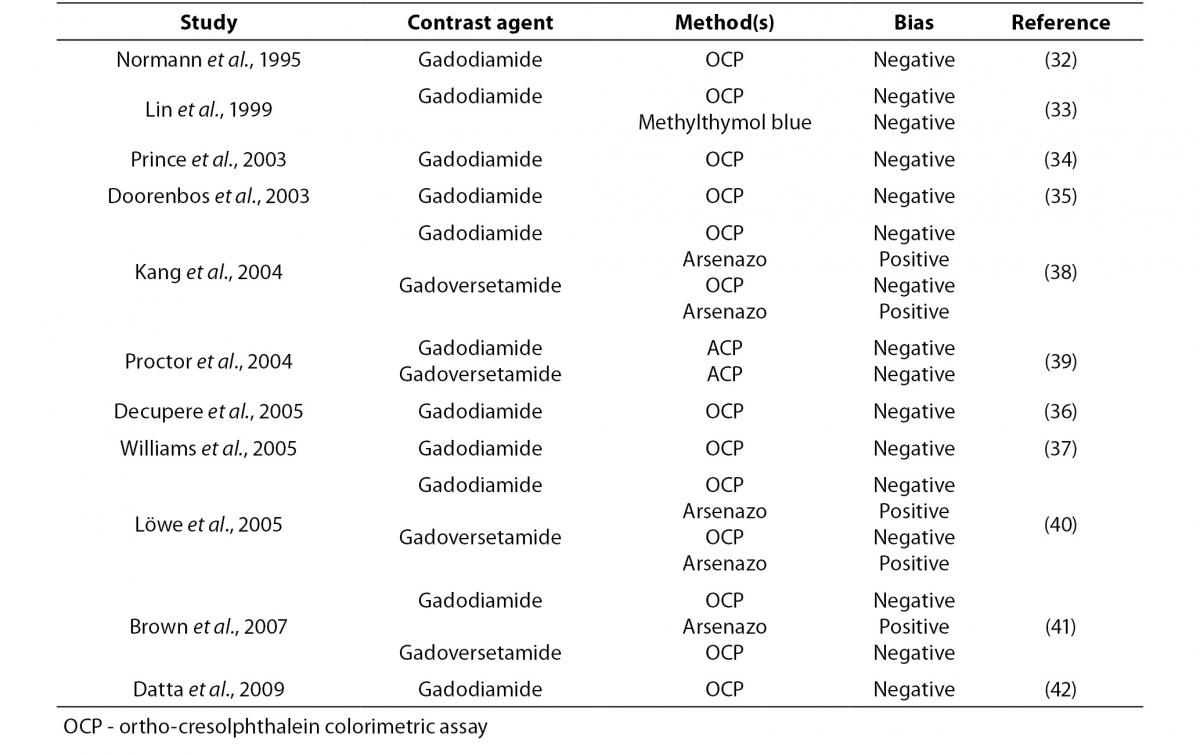
Gadolinium contrast agents are powerful chelators, so that their leading path of interference is attributable to this specific property. In an earlier report, Normann et al. (32) investigated the influence of the non-ionic MRI contrast medium gadodiamide on colorimetric assessment (i.e. photometric test using ortho-cresolphthalein; OCP) of serum calcium, and showed that results of measurement exhibited a significant negative bias as compared with quantification by ion-selective electrodes. The extent of interference was also strictly correlated with the concentration of contrast medium. In a following publication, Lin et al. (33) investigated the potential interference of linear (gadodiamide and gadopentetate) or macrocyclic gadolinium complexes (i.e. gadoterate) on serum calcium measured by conventional colorimetric techniques (i.e. OCP or methylthymol blue reagents). Interestingly, no interference was found when mixing gadopentetate or gadoterate with serum, whereas the solution containing gadodiamide produced a concentration-related bias in measured calcium concentration using both methods. With the aim of evaluating the frequency of spurious hypocalcemia after gadodiamide-enhanced MRI, Prince et al. (34) reviewed serum calcium values measured with OCP colorimetric assay in 896 inpatients undergoing gadodiamide-enhanced magnetic resonance imaging (MRI). The mean reduction of serum calcium measurement after gadodiamide injection was 0.08 ± 0.91 mmol/L, with a maximum variation of 0.47 mmol/L. A decrease was observed in approx 58% of patients undergoing gadodiamide-enhanced MRI, and in nearly 16% of cases this reduction was from a normal calcium value to hypocalcemic status. Calcium reduction was significantly associated with serum creatinine level (r = 0.39; P < 0.001), gadodiamide dose (r = 0.37, P < 0.001), and inversely correlated with time between gadodiamide injection and blood collection (r = -0.28, P < 0.001). Even more importantly, seven patients were inappropriately treated with intravenous calcium and eleven with oral calcium as a result of spurious critical hypocalcemia. The presence of significant interference was also confirmed with in vitro studies, wherein gadodiamide interfered with colorimetric assessment of serum calcium. Additional cases of moderate to severe pseudohypocalcemia were also reported by Doorenbos et al. (35) (serum calcium measured with a not specified colorimetric technique) after gadodiamide-enhanced MRI angiography, Decupere et al. (36) using an OCP assay after gadodiamide-enhanced vascular MRI of the vertebrobasilar system, and Williams et al. (37) using an OCP method after gadodiamide-enhanced MRI. In another study, Kang et al. (38) carried out an experimental investigation to assess the extent of interference due to three gadolinium contrast agents on serum calcium assessment with OCP and arsenazo dye. Two of these compounds (i.e. gadodiamide and gadoversetamide) produced a marked negative bias using OCP-based methods (from -0.10 to -0.47 mmol/L), and a significant positive bias using the arsenazo-based assays (from 0.07 to 0.15 mmol/L). On the other hand, a third gadolinium contrast agent (i.e. gadopentate) did not affect calcium measurement with either method. The concentration of serum calcium was also assessed in 116 samples of patients receiving gadodiamide, and was found to be lower with one OCP method that with the other. The magnitude of bias was inversely associated with estimated glomerular filtration rate (GFR) and length of time since administration of contrast medium. Proctor et al. (39) investigated the interference of gadodiamide, gadoversetamide, gadopentetate, dimeglumine, and gadoteridol on several calcium assays, and found that gadolinium contrast agents caused no interference on two arsenazo assays, one inductively coupled plasma mass spectrometry (ICP-MS) technique, one ion selective electrode assay and one ionized calcium method, whereas a negative bias was observed with three OCP methods (between -9 and -24% for gadodiamide and between -9 and -22% for gadoversetamide, respectively). Löwe et al. (40) also evaluated the interference of commercially available gadolinium-containing contrast-enhancing agents with calcium measured with either an arsenazo-based colorimetric method or an OCP assay. Although gadopentetate and gadobenate did not significantly altered the concentration of calcium measured with either method, the presence of gadodiamide and gadoversetamide caused a positive bias with arsenazo-based colorimetry and a negative one with the OCP assay. Brown et al. (41) administered intravenous injections of four different gadolinium contrast agents (i.e. gadodiamide, gadopentetate dimeglumine, and gadoteridol) to 12 healthy volunteers and measured serum calcium levels with an OCP and arsenazo III methods, as well as with ICP-MS, at fixed time points from 5 to 240 min after injection. It was hence found a significant and negative bias in serum calcium concentration measured with the OCP assay after injection of both gadoversetamide and gadodiamide. For both compounds the effect was evident as soon as 5 min after injection, and persisted for up to 100 min. An increase of serum calcium assayed with the arsenazo III method was also observed 5 min after injection of gadodiamide.
Datta and Dasgupta (42) assessed whether a new arsenazo III dye for measuring calcium may be biased by the presence of gadodiamide or gadoversetamide in serum. Although the concentration of calcium measured with a traditional OCP method was reduced by approx 40% in the presence of gadolinium contrast agents, no significant bias (i.e. < 4%) was observed in that measured with the new assay. More recently, Löwe et al. (43) assessed the extent of interference from gadobutrol and gadoxetate with colorimetric assessment of calcium (arsenazo and OCP methods). The results of calcium measurements were comparable for both contrast agents and only small fluctuations were observed, which mostly fell within the usual range of experimental error.
Even more interestingly, Gandhi et al. (44) assessed the clinical and economic impact of spuriously decreased serum calcium values (OCP method) due to interference from gadoversetamide in 766 patients in whom the compound had been administered for diagnostic purposes. In approx 20% of patients who had calcium reassessed with an OCP assay less sensitive to gadoversetamide interference, the difference between methods was greater than 0.175 mmol/L and in 2% of patients this difference was greater than 0.35 mmol/L. Calcium supplementation was started in 22 out of 56 patients (i.e. 39%) with marked spurious hypocalcemia. The total additional expenditure (including reagents and laboratory technologists time) for troubleshooting spurious hypocalcemia was estimated at $76.5 / day.
As regards analytical interference on other laboratory parameters, Proctor et al. (39) studied the potential interference of gadodiamide, gadoversetamide, gadopentetate, dimeglumine, and gadoteridol in as many as 41 serum assays. Significant interference was found for angiotensin-converting enzyme (ACE; -74% for gadodiamide and -68% for gadoversetamide, respectively), total iron binding capacity measured with the ferrozine method (TIBC; 27 to 49% for gadodiamide and 21 to 29% for gadoversetamide, respectively), zinc measured with a manual colorimetric assay (-85% for gadodiamide, -74% for gadoversetamide, -58% for gadopentetate and -13% for gadoteridol, respectively). The concentration of magnesium was also found to be significantly increased using calmagite method (+17% for gadodiamide and +24% for gadoversetamide, respectively), but not when measured with methylthymol blue, xylidyl blue and formazan assays. Haylor et al. (45) assessed the effect of five gadolinium contrast agents (i.e., gadodiamide, gadoversetamide, gadopentetate, gadobutrol and gadoterate) on serum creatinine measured with both Jaffe kinetic reaction and an enzymatic assay. Although no substantial bias could be observed with the enzymatic assay for any contrast agent, the Jaffe kinetic reaction exhibited a significant positive bias in the presence of large doses (i.e.
≥ 2.5 mmol/kg body weight) of gadodiamide, gadodiamide and gadoversetamide, yielding to false positive results. An occasional report of positive bias in selenium measurement by inductively coupled plasma-quadrupole mass spectrometry after administration of a contrast agent containing gadolinium has also been reported by Walter et al. (46).
≥ 2.5 mmol/kg body weight) of gadodiamide, gadodiamide and gadoversetamide, yielding to false positive results. An occasional report of positive bias in selenium measurement by inductively coupled plasma-quadrupole mass spectrometry after administration of a contrast agent containing gadolinium has also been reported by Walter et al. (46).
Irrespective of the precise mechanisms involved (either biding of dye to gadolinium, or binding of calcium to the free contrast media), several lines of evidence attest that calcium measurement may be highly unreliable in the presence of gadolinium contrast agents (Table 1). Particular caution should hence be used when interpreting results of calcium (and other parameters) in patients undergoing MRI with gadolinium contrast agents. Since the elimination half-life of the these compounds is approximately 90 to 100 min in patients with preserved renal function (41), laboratory testing should be delayed until complete elimination of contrast media because the effect of residual dye is heterogeneous, and test results may be biased due to dilutional effects or unpredictable interference with specific laboratory assays. An additional issue is the potential interference of some of these compounds on appropriate formation of the gel barrier in primary blood tubes. Although serum or plasma may be extracted from beneath the gel barrier, collection of another sample should be seen as a more reliable approach to safeguard patient safety.
Table 1. Interference on gadolinium contrast agents on calcium assessment.
Interference from Patent Blue V
Patent Blue V is a synthetic inert dye that is typically used during cancer surgery for identifying lymph node metastases (47). Darby and Broomhead (48) spiked normal serum samples with increasing concentrations of this chemical substance (from 4.9 to 22.7 mg/L), and found a linear dose-response positive interference in lipaemic index and a linear dose-response negative interference in hemolysis and icteric indices. No significant interference was however observed in the measurement of several clinical chemistry analytes, including sodium, potassium, urea, creatinine, bilirubin, alanine aminotransferase, gamma-glutamyltransferase, aspartate aminotransferase, magnesium, creatine kinase, lactate dehydrogenase, amylase, albumin, calcium and phosphate. A similar effect on serum indices was further reported by McTaggart et al.(49). A variable interference of has also been reported in pulse oximeter readings and methaemoglobin measurement using different analyzers (50).
Conclusions
The use of contrast media is now commonplace in diagnostic imaging. Although there is a widespread perception that side effects and potential drug interactions may be the leading problems caused by these compounds, various degrees of interference with some laboratory tests have been clearly demonstrated. Incidentally, a wrong test result may jeopardize patient safety to a similar extent than a mishandled therapeutic act (51), and so every possible effort should be put in place for preventing or identifying potential sources of errors throughout the total testing process.
Overall, the described interference for iodinate contrast media include the appearance of abnormal peaks in capillary zone electrophoresis of serum proteins, positive bias in assessment of TnI with one immunoassay, whereas that for gadolinium contrast agents include a negative bias in calcium assessment with OCP assay and an occasional positive bias using some arsenazo reagents, a negative bias in measurement of ACE and zinc (colorimetric assay) and a positive bias in creatinine (Jaffe kinetic reaction), TIBC (ferrozine method), magnesium (calmagite reagent) and selenium (inductively coupled plasma-quadrupole mass spectrometry) assessment. Occasional interference has also been reported in serum indices, pulse oximetry and methaemoglobin in patients receiving Patent Blue V. Under several circumstances the interference was absent from manufacturer-supplied information and limited to certain type of reagents and/or analytes. As such, whenever a laboratory cannot rely on a manufacturer’s verification, local assessment of potential bias according to the current CLSI guidelines (6) may be advisable to establish whether or not the test in use may be biased by the presence of significant amounts of contrast agents in serum or plasma. Since the elimination half-life of all these compounds is typically lower than 2 h (41), collection of blood specimens after this period may be a safer alternative in patients who have recently received contrast media for diagnostic purposes. Alternatively, laboratory assays that are proven to be insensitive to this kind of interference should be preferred, at least when testing samples from patients who have recently received medical contrast agents.
One major unresolved issue, however, is to distinguish between in vivo and ex vivo effects of contrast agents. Lukasiewicz, for example, reported that the administration of non-ionic iodinated contrast media (i.e. iomeprol and iopromide) significantly increased the plasma concentrations of prothrombin fragment 1+2 (F1+2) and thrombin-antithrombin complexes (TAT), but not those of D-dimer and beta-thromboglobulin (β-TG) (52). Although it was hence concluded that non-ionic agents may exert significant effects on hemostatic activation, the biological pathway leading to alteration of F1+2, TAT and D-dimer is generally overlapping (53), so that it could not be definitely ascertained whether these changes were the result of a real biological effect or rather of analytical artefacts, especially if one considers that the current guidelines of the European Society of Urogenital Radiology (ESUR) Contrast Media Safety Committee report that all contrast media have anticoagulant and not pro-coagulant properties (54).