Introduction
Life is not a static condition, but a continuous fluctuation of the components in biological fluids. The biological variation (BV) of the human body components examined in laboratory medicine (analytes) can be described as of three types, namely, variation over the span of life, predictable cyclical variation that can be daily, monthly or seasonal in nature, and random variation. The biological variation occurring over a person’s lifetime is related with the physiological changes inherent to growth, aging, pregnancy, menopause, and other normal circumstances. Predictable cyclical variation occurs in components that are affected by outside influences such as light-dark or a season of the year and those whose release to the circulation is dictated by regular time intervals, such as the release of various hormones of cellular origin to the circulating blood (1). Apart from these types of variations, there is a subtle variation affecting all analytes which consists of random fluctuation around the setting point of each individual, known as the within-subject or intraindividual biological variation. Each person’s setting point may be different from another’s, and the overall variation resulting from this difference is known as between-subject or interindividual biological variation (2).
In laboratory medicine, a science that measures constituents from living organisms, it is essential to take into consideration the biological variation concept to provide reliable results. All acts of measuring have some degree of inherent variability. In laboratory measurements there is a potential variability in sample collection, sample transport and storage, preparation of reagents, maintenance of instruments, type of method, etc. and in medical laboratories there is additional and inevitable variation inherent to the biological sample. To obtain reliable results all the sources of variation should be minimized and this is possible for all related laboratory processes except the inherent variation of the sample. So what can we do? We have to perfectly estimate the components of biological variation (within-subject and between-subject) and appropriately manage them during the entire process leading to the laboratory report.
Briefly, estimation of the magnitude of within- and between subject BV requires the following procedure (3):
1. A number of samples are obtained from a number of individuals whose health status is known.
2. Samples are stored in stable conditions until analysis.
3. Samples are analyzed and simultaneously, analytical CV is determined by control materials or duplicate sample testing.
4. The components of variance (analytical, within-subject and between-subject) are determined by analysis of variance (ANOVA) of obtained results.
To assure the reliability of BV estimates, several preanalytical factors require close control. If the subjects studied are healthy individuals, they should maintain their normal lifestyle during the time of sample collection. The conditions for blood extraction are strictly defined and applied to all subjects. Sample collection should be performed by the same phlebotomist, at the same time of day, and with the same tourniquet time, after the subject has rested for some minutes. These same conditions are applied when estimating BV for non-healthy persons (e.g. patients with disease, transplant recipients) with the additional requirement that they be in a stable condition within their non-healthy status (4,5).
When these conditions are fulfilled, the results of BV estimates in adults are similar regardless of differences in other intervening factors. From technical viewpoint, the sampling interval cannot be less than one day, but apart from this restriction the length of the interval is irrelevant (daily, weekly, monthly, etc.) (6). The number of subjects studied and samples taken is not highly important, but it may be recommended that at least 10 subjects and 5 samples be used. The analytical method, instrument and reagents used in the study make no difference in BV estimates. The factors inherent to the subject, such as sex, age, race, geographical place of residence, do not produce changes in results (2,7). These considerations have been manifested in several studies in which BV was estimated for numerous analytes (8-10). All the currently available estimates of BV (around 320 analytes) have been compiled in a database which is updated every two years (11,12). Hence, for many common tests, this information is already available for laboratory use. Nonetheless, much work in this line remains as there are hundreds of constituents for which BV has not yet been estimated. Future work should focus on these specific tests.
In daily laboratory practice, BV has eight main applications, apart from being useful in epidemiological studies:
1. Setting quality specifications for analytical performance.
2. Evaluating the clinical significance of changes in consecutive results from an individual.
3. Assessing the usefulness of population-based reference values.
4. Determining which sample (e.g. plasma, serum, 24-urine, first-morning urine) is optimal for analyzing a specific constituent.
5. Selecting the best test among several for a specific clinical purpose (eg, diagnosis, monitoring).
6. Selecting the most informative units of expression for each analyte for reporting results.
7. Determining the number of analyses needed to establish an individual’s homeostatic set point.
8. Validating new procedures in a laboratory.
Setting quality specifications for analytical performance
Setting quality specifications based on within- and between subject BV has been recognized to be the second hierarchical strategy agreed worldwide at the Stockholm conference because it satisfies the general needs of diagnosis and monitoring (13). In a simple way, a single test from a subject is requested for diagnostic purposes and the result is compared with the population-based reference interval or a cutoff value; in this case, it is essential for laboratories to maintain the distribution of results well centered and, consequently, analytical bias has to be minimized. For monitoring or follow-up purposes, consecutive requests for a test are made and the main source of laboratory variation to be minimized is analytic imprecision. So quality specifications used as tolerance limits for imprecision and bias have clear practical utility.
Additionally, it has been demonstrated that if bias (also called systematic error) of laboratories working with the same population is maintained below ¼ of the sum of within- plus between subject BV, common reference intervals can be shared (14); the resulting value of this sum is considered to be the desirable bias. In monitoring, hazard error can affect the result only by 11% (15,16); the resulting value of this fraction is considered to be the desirable imprecision. For analytes with strong homeostatic regulation and very low BV values (such as sodium, chloride, albumin), it has been accepted that minimum quality specifications can be used which are based on a larger fraction of BV; on the other hand, for poorly regulated analytes with high BV values (such as urine analytes, triglycerides, several enzymes, etc.), optimum quality specifications derived from smaller fractions than those mentioned could be used (17).
Evaluating the clinical significance of changes in consecutive results from an individual
Evaluating the clinical significance of changes in two consecutive results from an individual implies taking into consideration both the analytical and the physiological sources of variation (assuming that preanalytical sources of variation are minimized). The numerical value that delineates medically significant changes between two results, classically named “critical difference” (3) and today called Reference Change Value (RCV) (18), comes from the formula:
with k = 1.65 for a one tail test and a probability risk α of 95%, and CVA and CVI the analytical and the within-subject (or intraindividual) coefficients of variation, respectively.
Some authors use a slightly different formula that substitutes the parenthesis section by CVI+A (19); nevertheless, the results obtained with the two formulas are practically identical.
For laboratories reaching desirable quality specification, the formula depends exclusively on the CVI, and then the RCV value is the same for all laboratories (although explicit for each analyte) (20). This would imply a transversal RCV concept for detecting changes in health status, which is a better approach than the population-based reference interval since the majority of analytes have strong individuality (within-subject BV lower than between-subject BV) (11,12).
Assessing the usefulness of population-based reference values
Assessing the usefulness of population-based reference values can be performed by determining the ratio of within-subject- to the between-subject BV, which is named “index of individuality”. When this index is lower than 1, which is usual for the majority of analytes compiled up-to-date, two consecutive results from a subject may be outside the RCV but well within the population-based reference interval. In this case, interpretation of a test result is more certain to be correct if at least two requests have been made and the difference between the two results for the same test is higher than the corresponding RCV. As a consequence, comparison of the result of a single test with the population-based reference interval is a satisfactory practice only for analytes with the index of individuality higher than 1. The maximum sensitivity for these purposes is possible with individuality indexes equal or lower than 0.6 and equal or higher than 1.4 (3).
Determining optimal sample for analyzing a specific constituent
Determining which sample type (plasma, serum, 24-urine, first-morning urine) is optimal for analyzing a specific constituent) may be based on within-subject biological variation estimates. The sample with lower CVW is the best one because the source of variability inherent to the body fluid is minimized. For example, serum creatinine CVI is 5.3% and 24 hour urine CVI is 16% so that serum creatinine is preferred for the follow up of renal disorder. For the majority of analytes, serum or plasma are better than urine samples because of the stronger physiological regulation of blood components, compared with urine homeostasis.
Selecting the best test for a specific clinical purpose
On the selection of the best test among several ones for a specific clinical purpose (e.g. diagnosis, monitoring) can also be decided using BV estimates. For diagnosis, it is better to use a single test and compare the result with a population-based reference interval or a cut-off value than using serial tests for the same analyte. For example, various tests can be (in theory) ordered to detect a renal disorder. In the following table, the CVI, CVG, individuality index (II) and RCV for various renal related analytes are shown (table 1).
Table 1. BV-derived data for analytes in renal disorders
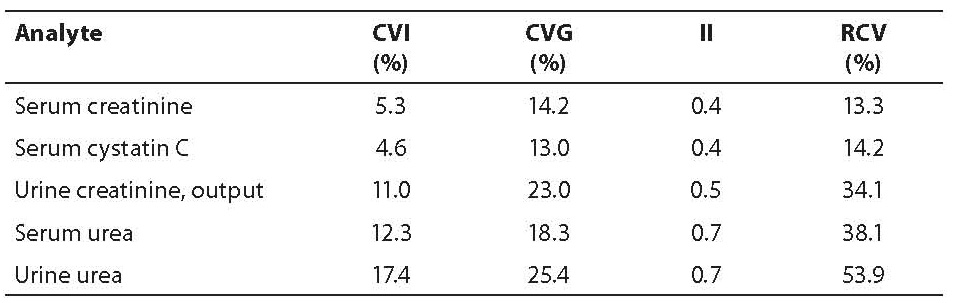
The test with high sensitivity for diagnosis is serum urea because of the highest II. In the case of the follow up of patients with a renal disorder, serum cystatin C has the maximum sensitivity to detect a change in health status because of its low RCV.
Selecting the most informative units of expression for reporting results
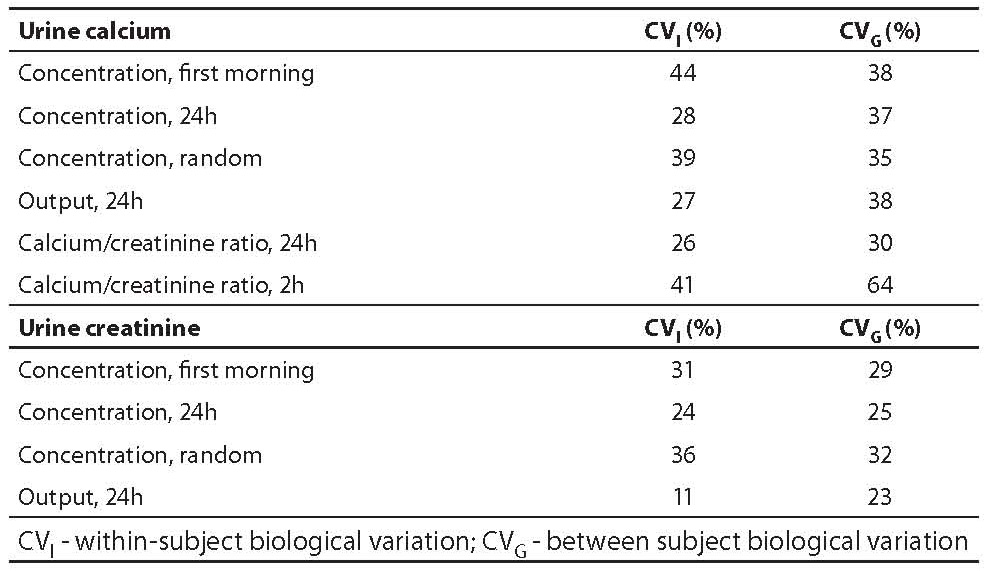
Selecting the most informative units of expression for reporting results can also be made on the basis of BV estimates of analytes, expressed in different units. For the majority of urine constituents, results can be expressed in concentration, output and ratio versus creatinine. Additionally, four types of urine samples can be used: 24h, first morning, random, and 2 hours. Examples for calcium and creatinine illustrate that 24 hour urine is the sample with lower within-subject variation and is even better if expressed in output units. This is valid for all urine analytes compiled in our database (table 2).
Table 2. BV estimates for urine analytes
Determining the number of analyses needed to establish an individual’s homeostatic set point
Determining the number of analyses needed to establish an individual’s biological set point is very well explained in Fraser’s articles (3,21) where the most important conclusion is that, for the majority of human body components, a single determination is not sufficient to establish the homeostatic set point. This is usually forgotten in the already existing guidelines for diagnosis where, in general, a single test is advocated. Thus, there is a need to include laboratory professionals in future revisions of these guidelines to assure satisfactory laboratory-related healthcare.
Validating new procedures in a laboratory
Validating new procedures in a laboratory is a common practice and also a specific requirement when implementing a quality management system, according to ISO 15189 (22) or ISO 9001 (23). In this activity, a quality specification for each procedure is needed and it should be derived from biological variation, as has been promoted since many years ago (12, 24-26).
Aim
To focus on main points of discussion debated in numerous presentations of data on BV made by the authors in the past 10 years (how quality specifications derived from BV in healthy subjects are attainable with current technology and in what cases data from non-healthy subjects should be used).
Points of discussion
Quality specifications have been derived from data on biological variation in healthy subjects and based on the best sample (24 hour urine, expressed in output units). Although several authors judge this practice quite idealistic for analytes with very low CVI, such as sodium, albumin or chloride, Figure 1 shows that around 10% of the laboratories participating in the external quality assurance program of the Spanish Society of Clinical Biochemistry and Molecular Pathology (SEQC) attain the specification for total error derived from BV for albumin, 20% for HDL cholesterol, 50% for sodium and chloride and 70% for calcium. This fact demonstrates that specifications based on biology are realistic and can be reached for routine laboratories today.
Another point deals with analytes that are almost exclusively tested in non-healthy subjects, such as HbA1C used for monitoring diabetic patients. It has been mentioned above that laboratory should reduce its analytic imprecision below half of the within-subject BV for monitoring and follow-up purposes. This is difficult for HbA1C, with a CVI of 1.9% and a desirable CVA of 1.0% (12).
In this particular situation it is of great interest to look at BV in diabetic patients in whom a CVI of 4.3% has been estimated for HbA1C and a consequent desired CVA of 2.1% (27,28) that is easily attainable with HPLC routine methods.
Moreover, by applying the highest quality level of the Stockholm consensus conference, an international enquiry addressed to 2538 clinicians that monitor diabetic patients in 7 countries has evidenced that medical requirement for CVA ranges from 2.2 to 9.1% (depending on the country) for low HbA1C values (29).
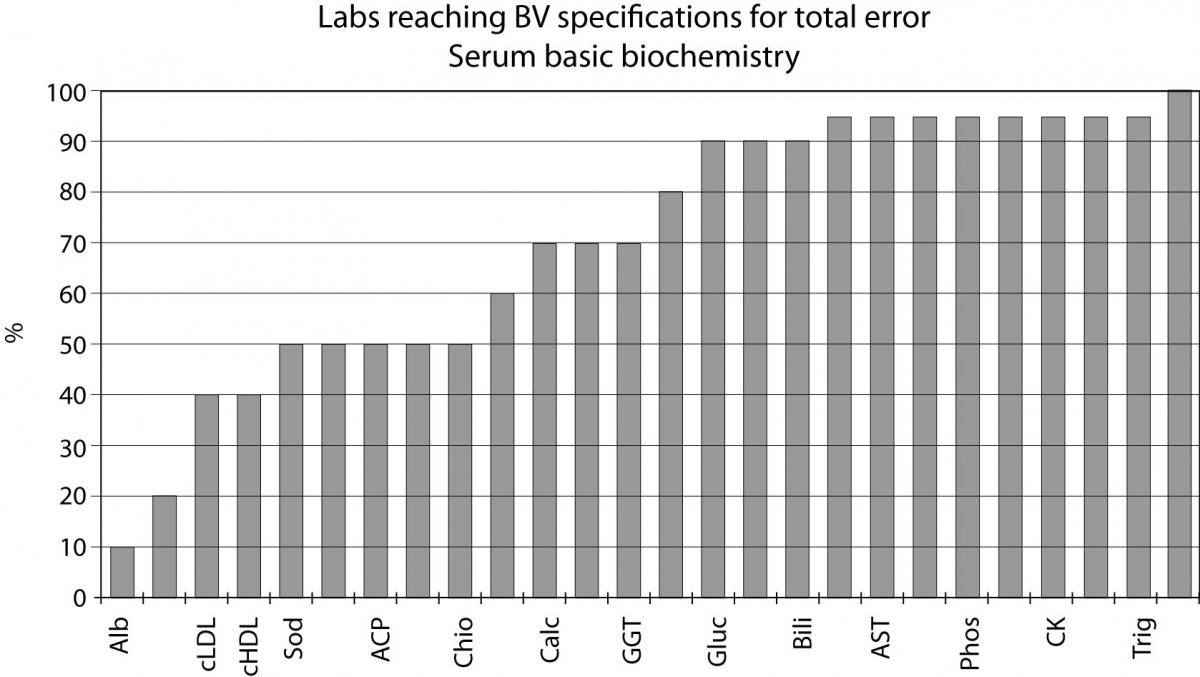
Figure 1. Labs reaching BV specifications for total error serum basic biochemistry
Future (Conclusions)
In our opinion, the most important advance of the role of a medical laboratory is to notify doctors about changes in patient status.This practice should be applied to all laboratories in the near future because all the necessary elements are already well known today. This activity is based on the RCV values clearly defined for healthy and many non-healthy situations (18,25,26,30) and on the statistical probability to define a significant change, excellently explained by Fraser (13,30). The laboratory information system should be able to:
- recognize the presumptive diagnosis of each patient;
- identify the target analyte for pathology;
- apply the RCV for the target analyte to each pair of consecutive results from the same patient;
- flag the second report with a predefined signal after the numeric result of the target analyte.
This practice will be more useful than the worldwide used flags for comparing each test result with the corresponding population-based reference interval because, as has been mentioned above, most analytes have strong individuality and comparison of a test result from a patient with the previous value will replace the classic reference interval.
The authors hope this short review will be useful for improving the quality of healthcare.