Introduction
Olympus AU2700 plus (Olympus CO Ltd., Tokyo, Japan) is the new Olympus platform designed for clinical chemistry laboratories with large number of samples. Analytical evaluation of Olympus AU2700 plus analyzer was conducted upon the arrival of the analyzer at Clinical Department for Laboratory Diagnostic, Dubrava University Hospital, according to the protocol of the European Committee for Clinical Laboratory Standards (ECCLS) (1).
Analytical evaluation of the analyzer and methods should be done before the introduction of the new analyzer into the routine use in order to confirm declared specifications of the analytical methods (2–4).
Olympus AU2700 is an automated, multi-channel, selective analyzer where the measurements are carried out using the spectrophotometry, turbidimetry and indirect potentiometry (using ion-selective electrode - ISE unit) in serum, urine, cerebrospinal fluid, and other types of body fluids. Analyzer can process 1600 tests per hour, including 270 ISE unit tests on the working temperature of 37 ± 0.3 °C. It is possible to program 99 different analyses at most. Analyzer can process 51 analyses simultaneously (48 different analysis and 3 electrolytes analysis on ISE unit). Olympus AU2700 plus has the same settings as the Olympus AU2700. Reagents are one- or two-component, located in two separate thermostated containers (4-12 °C). Analyzer uses the original reagents that are recognized using barcode readers or reagents from other manufacturers that are placed into specific positions in the reagent containers. Type of reaction determines the number of reagents used for the specific test. Samples are pipetted using a mechanical arm with two needles, which enables simultaneous pipetting in two parallel cuvettes. Analyzer has the possibility of continuous control monitoring, and statistical data processing obtained during operation (daily control and day-to-day control).
In this study we aimed to assess the analytical performance of 22 analytes determined on Olympus AU2700 plus analyzer (Beckman Coulter, Tokyo, Japan). For these analytes, a comparison with the Olympus AU2700 analyzer (Olympus CO Ltd.,Tokyo, Japan) was also done.
Materials and methods
Methods
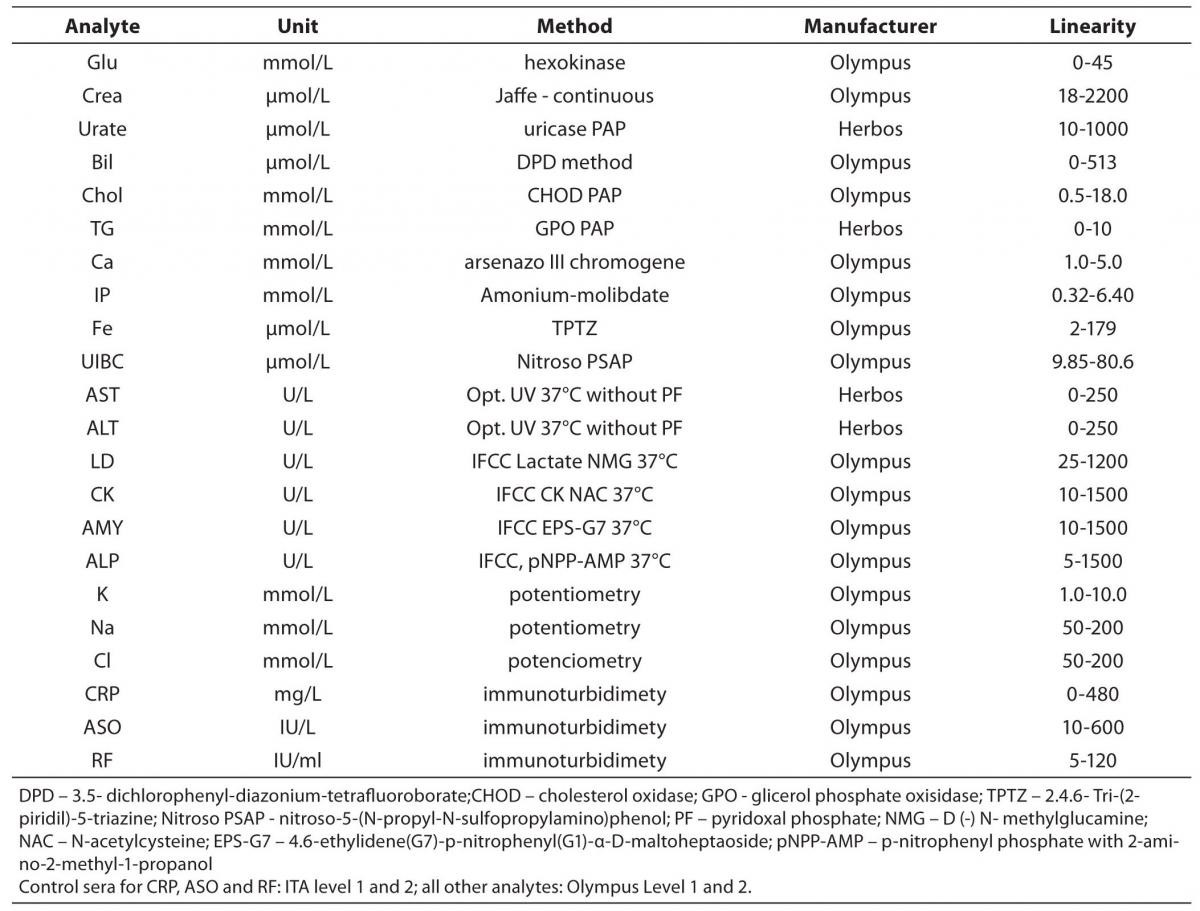
The tested analytes were as follows: glucose, creatinine (Creat), urate, total bilirubin (Bil), cholesterol (Chol), tryglicerides (TG), calcium (Ca), phosphate (IP), iron (Fe), unsaturated iron binding capacity (UIBC), aspartate aminotransferase (AST), alanine aminotransferase (ALT), lactate dehidrogenase (LD), creatine kinase (CK), alpha-amylase (AMY), alkaline phosphatase (AP), potassium (K), sodium (Na), chloride (Cl), C-reactive protein (CRP), antistreptolysin O (ASO) and rheumatoid factor (RF). Testing was conducted at the Clinical Department for Laboratory Diagnostics, University Hospital Dubrava, Zagreb, Croatia. Olympus Life and Material Science Europa GmbH reagents (Hamburg, Germany) and reagents of Herbos Diagnostika d.o.o. (Sisak, Croatia) manufacturer were used. To validate the complete analytical performance of the analyser, for each method that analyzer performs (spectrophotometry, turbidimetry and indirect potentiometry) several analytes were chosen. Methods and reagents used for this validation are presented in Table 1. A commercial lyophilized control samples of human origin (Control Serum Level 1, ODC0003, lot 017; Control Serum Level 2, ODC0004, lot 018; ITA control serum level 1, ODC0014, lot and 0016K ITA control serum level 2, ODC0015, lot 0017 - Olympus Life and Material Science Europa GmbH (Hamburg, Germany) were used for evaluation. ITA control serum samples are used for CRP, RF and ASO, while Olympus Control Serum Level 1 and 2 are used for all other parameters. Commercial pool serum prepared at the Croatian Institute of Transfusion Medicine (Zagreb, Croatia) was also used for the assessment. Calibrations for the tested analytes were performed using recommended procedures for the evaluated analyzer, using the original calibrators (System Calibrator 66300, lot 0113D, Serum protein multi-Calibrator 1, ODR3021, lot 0026 and ISE low and high standard serum - Olympus Life and Material Science Europa GmbH (Hamburg, Germany).
Table 1. Methods and reagents used in the evaluation of Olympus AU2700 plus.
Analytical evaluation
Analytical evaluation of analyzer included the determination of within-run and between-run imprecision, inaccuracy (comparing to the declared values of the control sample) and methods comparison. Within-run and between-run imprecision were used to determine the extent of random error and accuracy (bias) was used to detect the extent of systematic error affecting the measurement (5,6).
Between-run imprecision was determined measuring the concentration of analytes in the control sera of different concentration ranges (Level 1, Level 2, ITA 1, ITA 2) and pool serum in duplicate during the period of 30 days. Imprecision was expressed as the mean and the coefficient of variation (CV%). Within-run imprecision was determined in duplicate on 30 consecutive measurements of different analyte concentrations in control sera (Level 1, Level 2, ITA 1, ITA 2) and pool serum and also expressed as a coefficient of variation (CV%).
Inaccuracy of measurement of control samples was shown as bias (B%), percentage of deviation of the analyte mean value from the control sera declared mean value. To calculate the bias, measured values from day-to day imprecision were used.
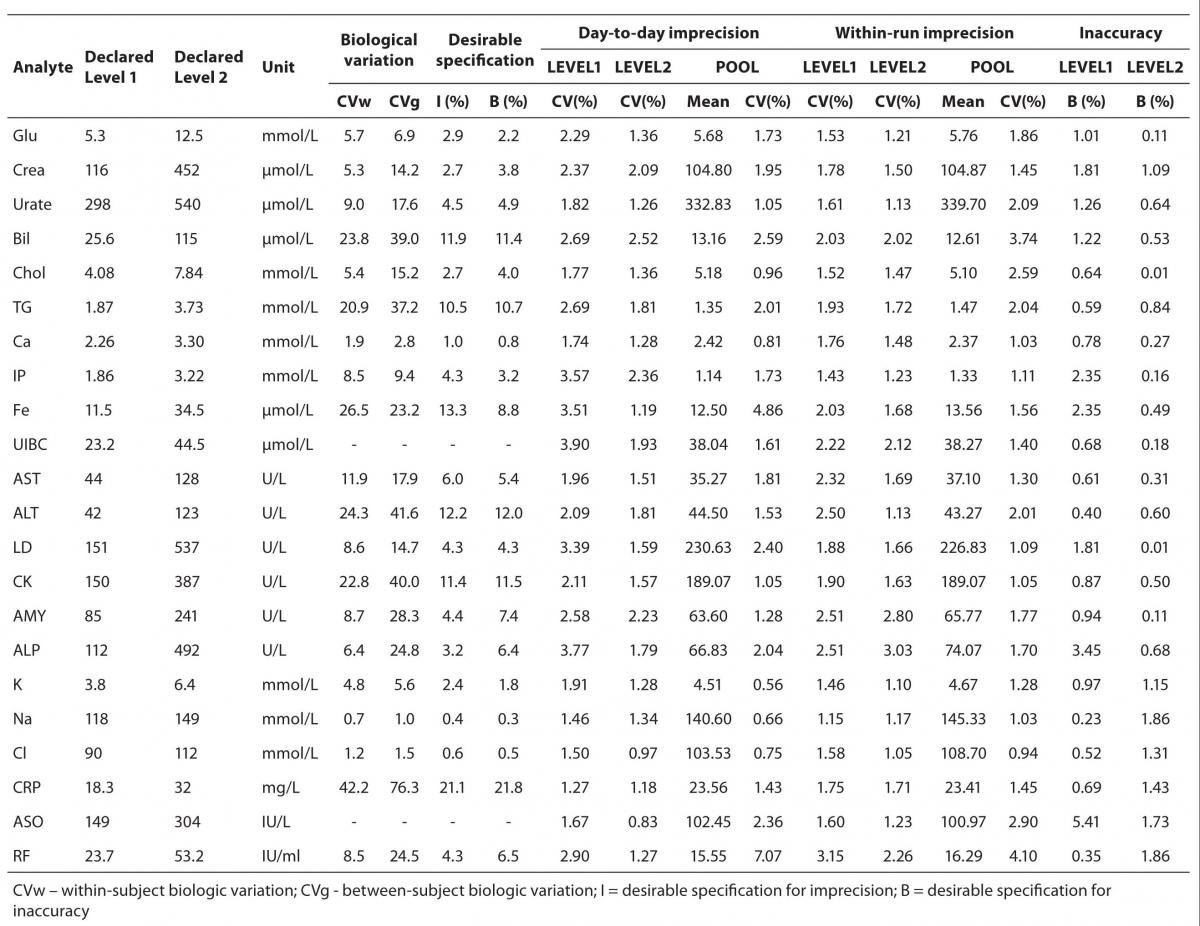
Obtained values for precision and bias were assessed by comparing with the specifications derived from biological variation (7). The desirable specifications for imprecision and bias, derived from biological variation are presented in Table 2.
Comparison of results obtained on Olympus AU2700 plus and Olympus AU2700 analyzers was conducted on 50 sera samples with a wide range of values. The sera used for the comparison were collected at different hospital departments of Dubrava University Hospital due to the routine hospital check-up of the patients. The samples were randomly chosen for the comparison and were centrifuged immediately upon the arrival in Clinical Department for Laboratory Diagnostics, Dubrava University Hospital, at 1000 x g for 15 minutes in 35 R Rotina Hettich centrifuge (Tuttlingen, Germany). All the samples were collected in BD Vacutainer glass serum tubes. The commercial pool sera used were stored at -20°C until the analysis.
Statistical analysis
Statistical methods included the calculation of mean, coefficient of variation (CV%) and bias (B%). Pearson correlation coefficient and Passing-Bablok regression, including the Cusum test for linearity were calculated for the method comparison. The level of significance was set at P < 0.01.
Statistical analysis, including descriptive statistics, was performed using MedCalc 9.2.0.0 software (MedCalc, Mariakerke,Belgium).
Results
Results of day-to-day imprecision are shown in Table 2. Coefficients of variation for day-to-day imprecision ranged as follows: in Level 1 from 1.46 % to 3.90%; in Level 2 from 0.97 to 2.52%; in ITA 1 from 1.27% to 2.90%; in ITA 2 from 0.83% to 1.27% and in pool serum from 0.56% to 7.07%.
The results of within-run imprecision are shown in Table 2. Coefficients of variation for within-run imprecision ranged as follows: in Level 1 from 1.15% to 2.51%; in Level 2 from 1.05% to 3.03%; in ITA 1 from 1.60% to 3.15%; in ITA 2 from 1.23% to 2.26% and for pool serum from 0.94 to 3.74%.
Test results for inaccuracy of control sera in two concentration levels are also shown in Table 2. For Level 1, bias ranged from 0.23% to 3.45%; for Level 2 from 0.01% to 1.86%; for ITA 1 0.35 to 0.69% and for ITA 2 from 1.43 to 1.86%.
Table 2. Desirable specifications for imprecision and bias derived from intra- and inter-individual biologic variation for the tested analytes, day-to-day, within-run imprecision and inaccuracy.
Comparison of the results obtained on the Olympus AU2700 plus and Olympus AU2700 Olympus yielded the correlation coefficients between 0.961 and 1.000 (Table 3). The target values used for the calculation of inaccuracy were provided by the manufacturer of the commercial control sera. The slope and y-axis intercept as well as their respective 95% confidence intervals (8) obtained using Passing-Bablok regression for all analytes are presented in Table 3.
Table 3. Correlation and Passing-Bablok regression data for Olympus AU2700 plus and Olympus AU2700 comparison.
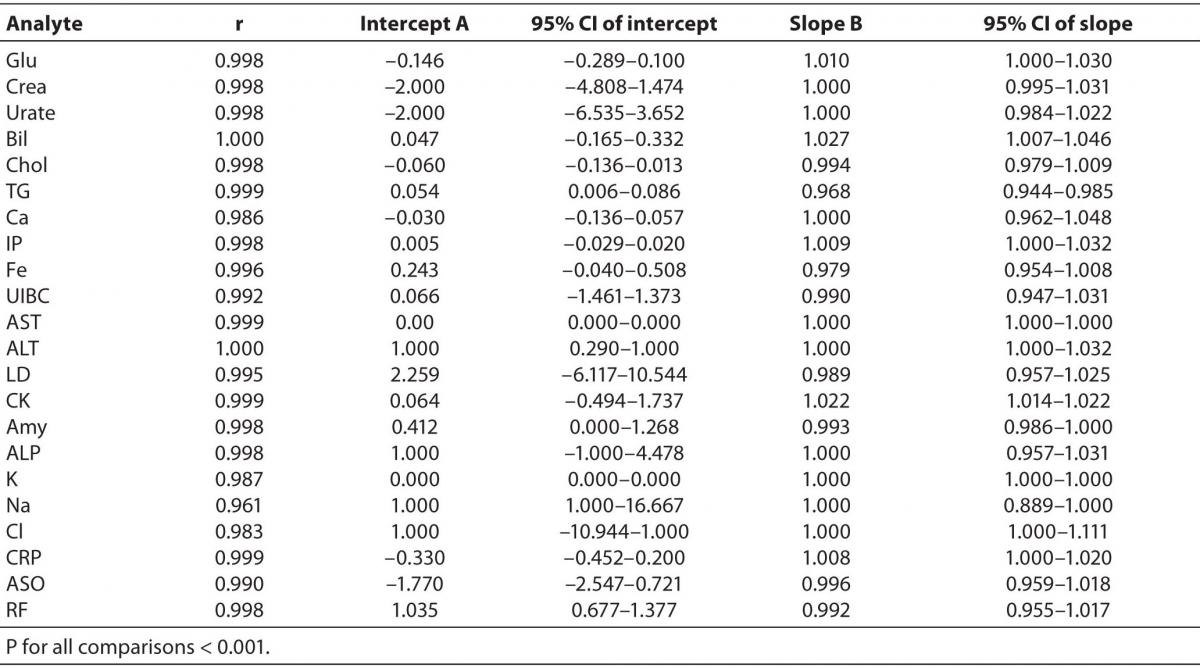
The Cusum linearity test performed on Passing-Bablok regression showed that there was no significant deviation from linearity for any analyte (P > 0.10) (9).
Discussion
The results of this analytical validation showed acceptable coefficients of variation for day-to-day imprecision, within-run imprecision, as well as a satisfactory degree of accuracy. For setting the criteria for acceptable imprecision and inaccuracy, we considered the biological variations of analytes (7,10,11). Depending on the measurement procedure, measuring instruments and compliance with a reference or definitive method, we can assess whether the new method or analyzer is suitable for routine use, and whether they are of satisfactory accuracy (2,3,5,12). For most analytes tested in this study, the results of imprecision and bias were in the range of desirable specifications for imprecision and bias, derived from biological variation (10,11). Bias and imprecision for sodium and chloride did not fulfil required criteria. However, it is important to emphasize that these criteria are very strict: bias of 0.4% and 0.6% and imprecision of 0.3% and 0.5%, for sodium and chloride, respectively. The reason for not fulfilling the desirable criteria for sodium and chloride is the low biological variation, as well as the lack of analytical method capable to follow that variation with the results that are precise and accurate enough. However, laboratories must be aware of this limitation, and ensure smaller measurement uncertainty using quality control tools (participation in external quality control assessment, control of preanalytical and postanalytical phase) (13,14).
Correlation analysis yielded high correlation coefficients proving high correlation for all the tested parameters.
Passing-Bablok regression showed that most analytes did not differ by a constant (95% CI of intercept includes 0), and that were well aligned, suggesting that there were no proportional differences between methods (95% CI of slope includes 1) (9). Despite of high correlations, some analytes did not meet the preferences of Passing-Bablok regression. When following Passing-Bablok regression strict criteria, ALT, RF, and sodium differed by a constant amount for both analyzers and the proportional difference between methods was found for CK, total bilirubin and triglycerides (Table 3). Passing-Bablok regression yielded a wide range of 95% CI of intercept for sodium, and that should also be considered when defining the analytical objectives. Unlike sodium, ALT and RF are a bit beyond the requested criteria (95% CI of intercept for ALT was 0.290-1.000 and 0.677-1.377 for RF), so in the analytical sense, those analytes follow the same linearity. Similar is the case with the CK, total bilirubin and triglycerides whose 95% CI of slope was very close to 1 (1.014-1.022, 1.007-1.046 and 0.944-0.985 respectively), therefore the analysis can be considered acceptably aligned.
Conclusion
Olympus AU2700 plus analytical analyzer shows acceptable precision and accuracy for majority of analytes, with the exception of sodium and chloride. Instrument is fully comparable with Olympus AU2700 analytical analyzer for all but several analytes (ALT, RF, sodium, CK, total bilirubin and tryglicerides) where only some minor deviations (constant and proportional difference) were observed.