Introduction
Method and instrument validation is important issue in clinical laboratory work. Each new method should be validated when introducing in routine laboratory work (1,2). Among different experiments that should be performed to access method’s performance (precision and accuracy) there is the comparison of methods experiment (3). That experiment compares results obtained using new method to those obtained using other analytical method. The ideal condition is achieved if analytical method used for comparison is reference or definitive method. Correctness of reference methods is non-questionable, so new method results should be fitted according to the reference. However, in usual circumstances in routine laboratory, correctness of methods is not well documented so they can not be considered as reference methods; definitive methods are unavailable, and results can be compared to “comparative method” – one available and used in daily routine work.
The aim of the comparison of methods experiment is to estimate systematic (constant and proportional) difference between two methods e.g. to find out if there is significant difference in their relative accuracy using real patient samples (3). Results should be interpreted very carefully. If the difference between two methods is small and clinically acceptable than those two methods can be used simultaneously and interchangeably. If difference is unacceptable it should be investigated further which of two methods is inaccurate (3). The experimental side of method comparison is simple. It is recommended that at least 40 samples of broad concentration range should be tested with two methods (3). Data analyses and interpretation is complicated issue that has been discussed for decades and still there is no gold standard for statistical procedure that should be used for method comparison data analyses (3).
Data analyses in the comparison of methods experiment
Standard statistical tests investigated difference between two sets of measured data, are not applicable for method comparison data analyses. Independent sample t-test should never be used because two sets of data were obtained on same biological samples which defining them as dependent samples. Paired t-test could be used for rough estimation of difference between two sets of data. It compares means of two samples and results will reveal constant but not proportional difference between two sets of measurement.
The test often used for method comparison data analyses, but does not provide proper conclusions, is Pearson’s correlation coefficient. When the same analyte is measured using two methods it is expected that correlation coefficient is very high, 0.99 or higher (3). Correlation describes linear relationship between two sets of data but not their agreement (4); it does not detect if there is a constant or proportional difference between two methods. Linear regression model (the least square regression) is more suitable for method comparison data analyses but it is very sensitive to data distribution (assumption of normal distribution), linear relationship and especially outliers. Furthermore, it presumes that comparative method results are measured without error (5-7). Considering all those limitations that model is also not suitable for data analyses.
Thus, several other statistical and graphical methods have been developed and proposed exclusively for method comparison data analyses such as: Passing and Bablok regression, Deming regression, Mountain plot, Bland and Altman plot (6-8). The aim of this article is to provide an overview of the usage and interpretation of Passing and Bablok regression.
Passing and Bablok regression results interpretation
Considering limitation of the ordinary least square regression model W. Bablok and H. Passing proposed regression model for comparison of methods based on robust, non-parametric model (9). Unlike to the least square linear regression Passing and Bablok regression is not sensitive towards outliers, assumes that measurement errors in both methods have same distribution, not necessarily normal, constant ratio of variance, arbitrary sampling distribution and imprecision in both methods. The requirements for Passing and Bablok regression are: continuously distributed measurements (covering broad concentration range) and linear relationship between two methods (6). Passing and Bablok regression calculates regression line equation from two data sets.
Result of Passing and Bablok regression consists of several parts and each has its role in interpreting method comparison data and concluding on methods agreement. The first result is scatter diagram with regression line that enables visual inspection of measured data and obvious agreement of fitted regression line and identity line (Figures 1A and 2A). Regression equation (y = a + bx) revealed constant (regression line’s intercept (a)) and proportional (regression line’s slope (b)) difference with their confidence intervals of 95% (95% CI). Confidence intervals explain if their value differ from value zero (0) for intercept and value one (1) for slope only by chance. Thus, if 95% CI for intercept includes value zero it can be concluded that there is no significant difference between obtained intercept value and value zero and there is no constant difference between two methods. Respectively, if 95% CI for slope includes value one, it can be concluded that there is no significant difference between obtained slope value and value one and there is no proportional difference between two methods. In such case we can assume that x = y and that there is no significant difference between methods, so both can be used interchangeably. The first example of Passing and Bablok regression analyses on data set obtained by measuring concentration of total bilirubin in patients’ serums using two different automated analyzers is presented at figure 1. Note that there is small constant difference between two methods (Figure 1). Compensation of that difference can be made after further investigation of accuracy of both methods. The second example presents data set obtained by measuring direct bilirubin in serums using two methods, revealing small constant but huge proportional error (Figure 2). Those methods differ seriously and can not be used simultaneously. Note that correlation coefficient in both examples is r = 0.99; proving that method comparison results can not be assessed using Pearson’s correlation.
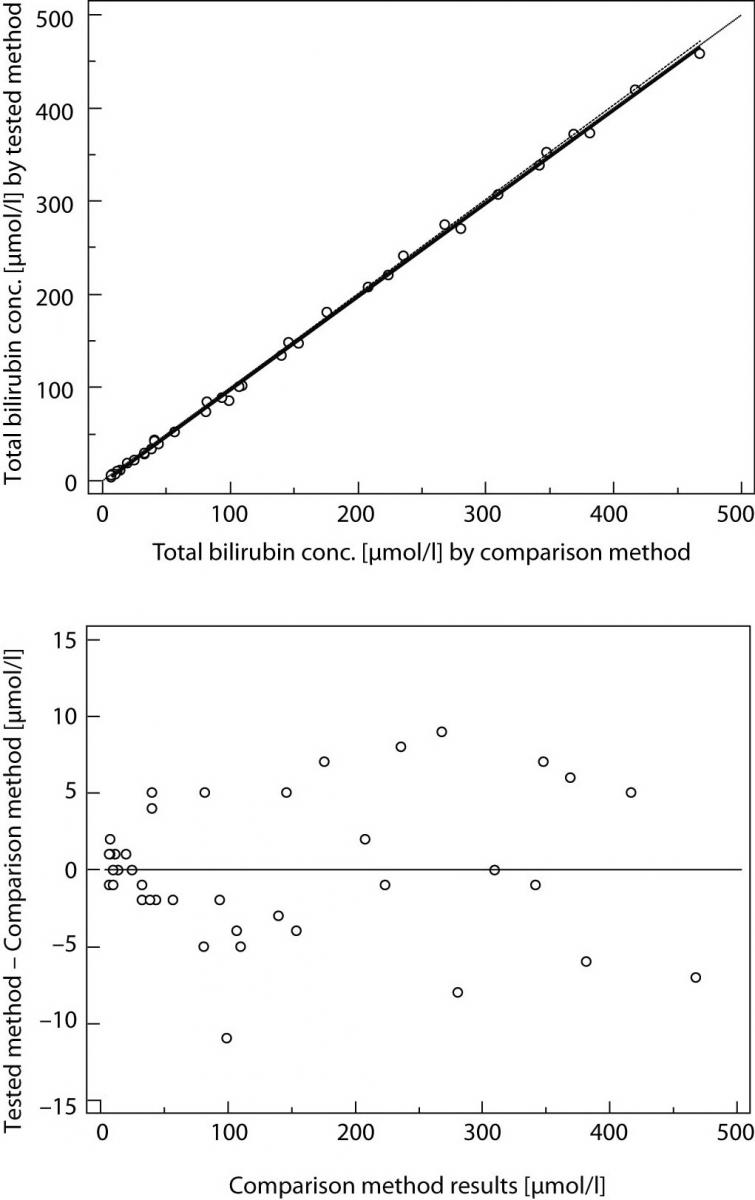
Figure 1. Passing and Bablok regression analyses of two methods for total bilirubin, N = 40; concentration range 3-468μmol/L; Pearson correlation coefficient r = 0.99, P < 0.001.
(A) Scatter diagram with regression line and confidence bands for regression line. Identity line is dashed. Regression line equation: y = -3.0 + 1.00 x; 95% CI for intercept -3.8 to -2.1 and for slope 0.98 to 1.01 indicated good agreement. Cusum test for linearity indicates no significant deviation from linearity (P > 0.10). (B) Residual plot presents distribution of difference around fitted regression line.
(A) Scatter diagram with regression line and confidence bands for regression line. Identity line is dashed. Regression line equation: y = -3.0 + 1.00 x; 95% CI for intercept -3.8 to -2.1 and for slope 0.98 to 1.01 indicated good agreement. Cusum test for linearity indicates no significant deviation from linearity (P > 0.10). (B) Residual plot presents distribution of difference around fitted regression line.
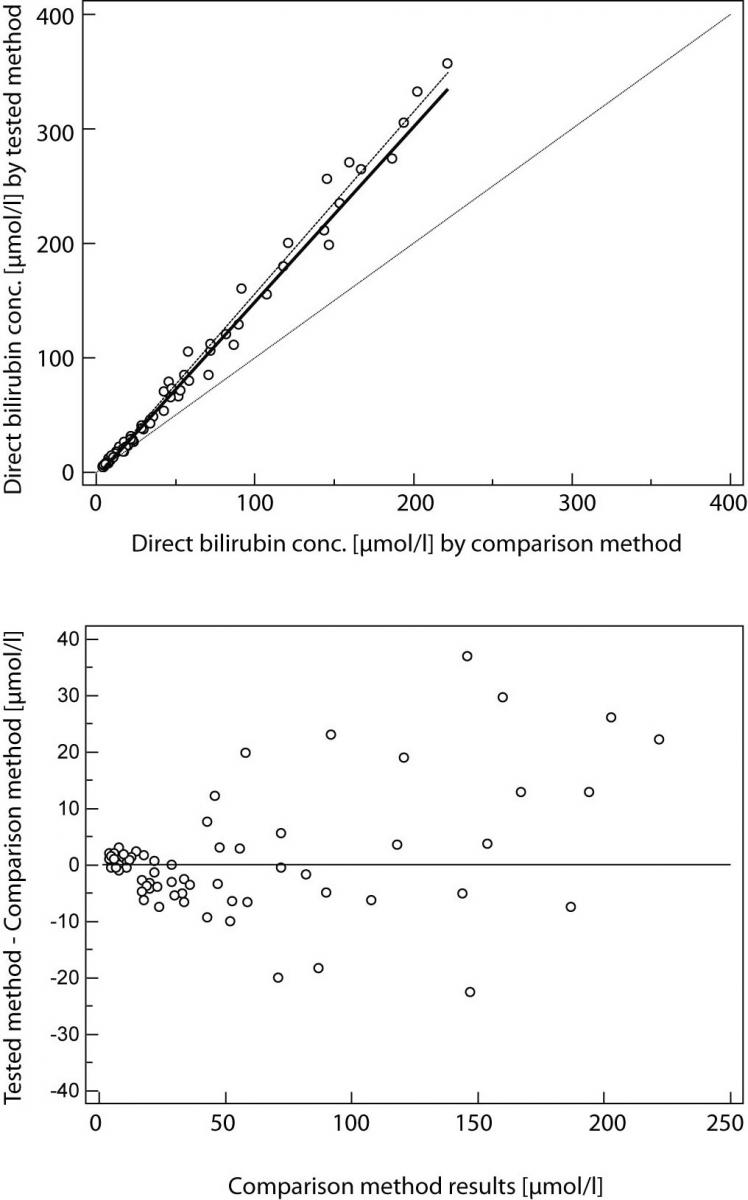
Figure 2. Passing and Bablok regression analyses of two methods for direct bilirubin, N = 70; concentration range 4-357μmol/L; Pearson correlation coefficient r = 0.99, P < 0.001.
(A) Scatter diagram with regression line and confidence bands for regression line. Identity line is dashed. Regression line equation: y = -3.2 + 1.52 x; 95% CI for intercept -4.2 to -1.9 and for slope 1.47 to 1.58 indicated small constant and huge proportional difference. Cusum test for linearity indicates significant deviation from linearity (P<0.05). (B) Residual plot presents distribution of difference around fitted regression line.
(A) Scatter diagram with regression line and confidence bands for regression line. Identity line is dashed. Regression line equation: y = -3.2 + 1.52 x; 95% CI for intercept -4.2 to -1.9 and for slope 1.47 to 1.58 indicated small constant and huge proportional difference. Cusum test for linearity indicates significant deviation from linearity (P<0.05). (B) Residual plot presents distribution of difference around fitted regression line.
Besides usual scatter plot Passing and Bablok regression provides the residual plot as well (Figures 1B and 2B). It shows residuals from fitted regression line and clearly revealed outliers, precision
allover the measurement range and visually identifies non-linearity. Regarding that linear relationship between two measurement data sets is required for obtaining statistically unbiased results, Passing and Bablok regression analysis calculates cumulative sum linearity test (cusum linearity test) that determinates if residuals are randomly distributed above and below regression line. Cusum test P value less than 0.05 indicates significant difference from linearity and two compared analytical methods should be further investigated; possibly higher number of samples with better continuous distribution should be consider.
allover the measurement range and visually identifies non-linearity. Regarding that linear relationship between two measurement data sets is required for obtaining statistically unbiased results, Passing and Bablok regression analysis calculates cumulative sum linearity test (cusum linearity test) that determinates if residuals are randomly distributed above and below regression line. Cusum test P value less than 0.05 indicates significant difference from linearity and two compared analytical methods should be further investigated; possibly higher number of samples with better continuous distribution should be consider.
Conclusion
Passing and Bablok regression is a good and appropriate model for analysis of method comparison results. Constant and proportional bias between two methods can be easily estimated and calculated parameters allow correction actions.