Introduction
Laboratory diagnostics is a complex enterprise, with the ultimate aim to provide reliable and appropriate information to the key stakeholders, i.e., patients and clinicians. Although it is commonly assumed that laboratory testing is trustworthy and safe, a variety of risks might arise throughout the total testing process. Some of these problems can adversely affect the quality of results and furthermore waste precious economic healthcare resources, as well as jeopardize patient safety. The testing process is traditionally divided in three major stages, namely the preanalytical, analytical and postanalytical phases. Due to remarkable technological advances and strict internal and external control of the process, a major degree of safety has been achieved in the analytical phase, as granted by high test accuracy and precision. Accordingly, the major vulnerabilities seem to arise now from the pre- and postanalytical phases (1). In particular, considerable data has been gathered to support the notion that the manually intensive preanalytical activities are responsible for the vast majority of errors throughout the total testing process, and upwards of 70% of all errors (1-4). These activities broadly entail the collection, handling, transport, preparation and storage of the specimens that are subsequently utilized for testing.
Several individual studies and critical reviews of the literature have now clearly established that spuriously hemolyzed specimens represent the most common preanalytical problem encountered in the daily laboratory practice. Their frequency is comprised between 2 and 3% of all of routine samples, which is nearly five-time higher than the second cause (i.e., clotted samples). More importantly, only minorities of hemolyzed specimens reflect an in vivo cause of hemolysis (i.e., hemolytic anemia, occurring in č3% of all hemolyzed samples) (5). Thus, most of the hemolyzed samples referred to the laboratory for testing reflect the breakdown of erythrocytes and other blood cells during the collection, handling and/or transportation of the specimens. The multitude of factors that might generate spurious hemolysis typically begins during venipuncture and then continues downstream throughout this process, up to the time of analysis. These factors can be classified as follows (6,7):
- Factors dependent upon patient’s conditions (e.g., fragile veins or unsuitable venous access);
- Factors dependent upon the ability of the phlebotomist;
- Factors dependent upon the venipuncture per se (e.g., traumatic blood draw, unsatisfactory attempts, vein missing, prolonged placement of the tourniquet);
- Factors associated with the devices used for collecting the sample (e.g., syringes, cannulas, butterfly devices, small gauge needles);
- Factors dependent upon the conditions for transport (e.g., prolonged transportation, unsuitable environmental conditions - excess heat or cold – as well as contact of tubes with frozen packs);
- Factors dependent upon processing of the specimen (e.g., force, time and temperature of centrifugation, or generation of poor barrier integrity between blood cells and serum or plasma);
- Factors dependent upon the storage of specimens (e.g., refrigerated as whole blood with poor barrier between cells and sample, freezing-thawing of samples, storage in cyclic defrost freezers).
The major problem encountered with hemolyzed specimens is represented by the varying degree of interference with some laboratory assays, which is typically dependent upon biological factors (e.g., leakage of intracellular components into serum or plasma, release of cell derived tissue factor and phospholipids), chemical and/or spectrophotometric interference of cell-free hemoglobin in certain assays (6,7).
It has been previously highlighted that whenever a laboratory test is unreliable due to the presence of an “interferent” such as cell-free hemoglobin, the results should be suppressed and blinded to the clinicians (6-8). Nevertheless, this procedure is challenging, since it might cause relational problems, especially with the emergency department where the burden of hemolyzed specimens is comparatively high (9), or with emergency physicians who need urgent results for rapid patient triage (10). The advantages of routine determination of plasma or serum cell-free hemoglobin concentration have been described (11). Corrective formulas have also been proposed, so that adjustment of the data obtained on hemolyzed specimens would permit to release test results with an appropriate accompanying post-analytical comment (e.g., “results obtained on a hemolyzed specimen, suggest repeat testing for confirmation”) (12-14), or the hemolysis index (HI) (15-18). Some caveats have however been highlighted in this policy, including the imprecise estimation of the analytes following the use of these corrective equations, due primarily to the large intra-individual variability. Therefore, to further assess whether correction of hemolysis-sensitive laboratory tests for the degree of cell-free hemoglobin might be suitable, we performed a series of studies on mechanically-induced hemolyzed samples and potential corrective formulas for reporting results on these specimens. This is of notable importance since most clinical chemistry instruments are now equipped with serum indices, including the HI, which are much more reliable than classically applied visual inspection (19,20), and would permit an instantaneously applied correction of test results by incorporating a HI-based equation within specific instrumentation, middleware software or within the laboratory information system (LIS) (21).
Materials and methods
Samples and methods
Blood was collected by a single experienced phlebotomist early in the morning into 6.0 mL siliconized vacuum tubes without gel separator and containing 18 U/L lithium heparin (Vacuette, Greiner Bio-One GmbH, Frickenhausen, Germany), by using a 20 gauge, 0.80 x 19 mm straight needle (Greiner Bio-One GmbH). Two consecutive primary tubes were drawn from each of 5 healthy volunteers recruited among the laboratory staff (3 males and 2 females, mean age 42 years; range 38-46 years). The study was carried out according to the Declaration of Helsinki and under the terms of all relevant local legislation, and all subjects provided written informed consent. The blood from the two primary tubes was pooled. Spurious hemolysis was obtained by a variation of the original method of Dimeski (22), i.e., by aspirating the blood with a 0.5 mL insulin syringe equipped with a very thin needle (30 gauge, 0.3 x 8 mm). A first aliquot (“#0”) was separated from the rest of the blood and processed without further manipulation. A second aliquot (“#1”) was obtained by a single aspiration of the pooled blood. A third aliquot (“#2”) was then obtained by a single aspiration of the blood in aliquot #1, a fourth aliquot (#3) by a single aspiration of the blood in aliquot #2, a fifth aliquot (#4) by a single aspiration of the blood in aliquot #3, and a sixth aliquot (#5) by a single aspiration of the blood in aliquot #4. This method has been validated to reliably mirror a traumatic blood collection with production of a poor quality specimen (22), and is also expected to produce injury to platelets and white blood cells (WBC), other than to red blood cells (RBCs). The anticoagulated whole blood was immediately assessed on an Advia 2120 (Siemens Healthcare Diagnostics, Tarrytown NY, USA) for hematological testing. Lithium-heparin plasma from each aliquot was also subsequently obtained by centrifugation at 2000 x g for 15 min at room temperature, separation from the cell pellet and then tested for lactate dehydrogenase (LD; DGKC method), aspartate aminotransferase (AST; IFCC method with pyridoxal phosphate activation), potassium and HI on a Beckman Coulter DxC (Beckman Coulter Inc., Brea CA, USA), following manufacturer specifications and using proprietary reagents. The HI is assessed on Beckman Coulter DxC by direct spectrophotometry. Semiquantitative values are calculated on a linear scale from 0 (0 g/L of hemoglobin) to 10 (hemoglobin from 4.5 to 5.0 g/L). The highly significant correlation between HI and cell-free hemoglobin (measured with the reference cyanmethemoglobin assay) has been reported elsewhere (23). When outside the linearity of the methods, the aliquots were further diluted in saline to obtain a definitive value. Total imprecision (i.e., CV) of all the parameters tested has been reported to be < 2.5% for both the ADVIA 2120 (24), and Beckman Coulter DxC (25). The same instruments and reagent lots were used throughout the study and all measurements were performed within a single analytical session.
Statistical analysis
The comparison of analyte-specific regression lines obtained from each of the five subjects was done by ANCOVA. Correlation was calculated between the baseline MCV (mean corpuscular volume) value and the slope of the RBCs equation. The bias of results was also compared with the quality specifications derived from biologic variation for each of the parameter analyzed (26).
Statistical analysis was carried out by using Dsaastat for Excel version 1.1 (available at: http://www.unipg.it/~onofri/DSAASTAT/DSAASTAT.htm).
Results
The main results of this investigation are reported in table 1. As expected, no significant amount of cell-free hemoglobin was found in the baseline aliquot #0 (i.e., HI of 0 in all samples, cell-free hemoglbin < 0.5 g/L). Conversely a progressive amount of cell-free hemoglobin was observed in the subsequent aliquots: aliquot #1, HI of 15±6 (cell free hemoglobin č7.0 g/L); aliquot #2, HI of 29±11 (cell free hemoglobin č14.0 g/L); aliquot #3, HI of 45±14 (cell free hemoglobin č22.0 g/L); aliquot #4, HI of 59±17 (cell free hemoglobin č29.0 g/L); and aliquot #5, HI of 76±22 (cell free hemoglobin č37.0 g/L). A highly significant inverse correlation was observed between HI and RBC count, hematocrit, MCV, LD, AST and potassium, whereas a highly significant negative correlation was observed with the Mean Corpuscular Hemoglobin (MCH). No significant correlation was instead observed between HI and hemoglobin, platelet count and glucose (Table 1). A marginally significant, negative correlation was observed between the HI and WBC count. In particular, although an evident trend was observed towards decreasing values of the WBC in parallel with the increase of the HI, the overall behavior was extremely heterogeneous among the study population, as shown in figure 1. Similarly, the platelet count also exhibited an apparent and remarkable increase in grossly hemolyzed specimens (i.e., HI > 100; cell-free hemoglobin of č50 g/L). The comparison by ANCOVA of analyte-specific regression lines obtained from each of the five subjects studied revealed that the resulting individual equations significantly differed (i.e., P < 0.001) among the five subjects for all parameters tested except potassium (P = 0.090) (Figure 2). A significant correlation was also observed between the baseline MCV value and the slope of the RBCs equation (r = -0.901; P = 0.037). As regards the clinical significance of these variations, in all circumstances the sy,x calculated from the individual linear regression analysis between the HI and the parameters, largely exceeded the quality specifications for desirable bias when expressed as percentage bias (Table 1).
Table 1. Correlation and linear regression analysis between the Hemolysis Index and results of hematological and clinical chemistry parameters in mechanically hemolyzed specimens collected from five healthy volunteers.
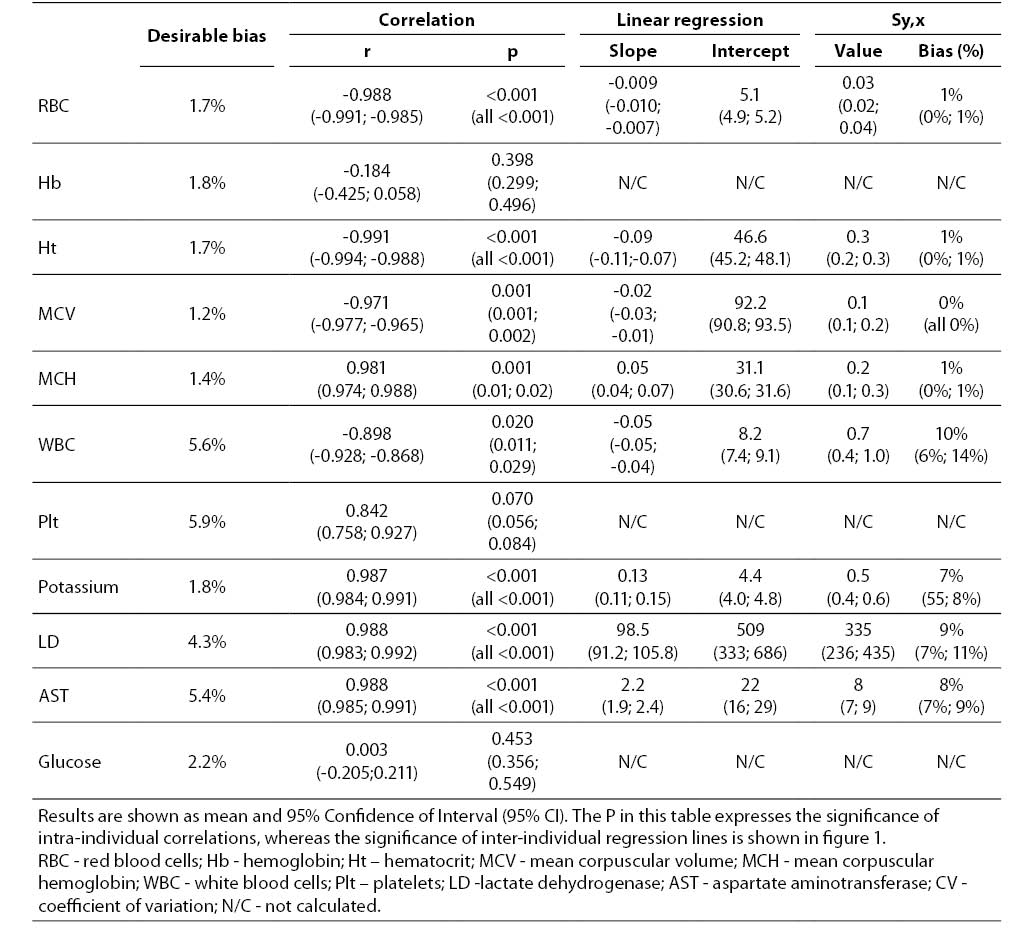
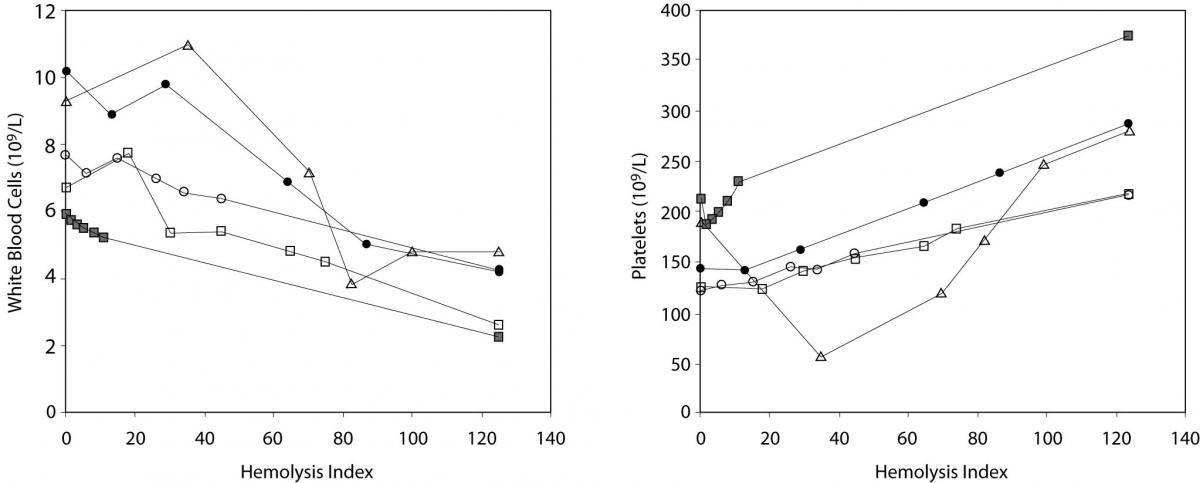
Figure 1. Behavior of white blood cell (WBC) (1A) and platelet (1B) count in mechanically hemolyzed specimens.
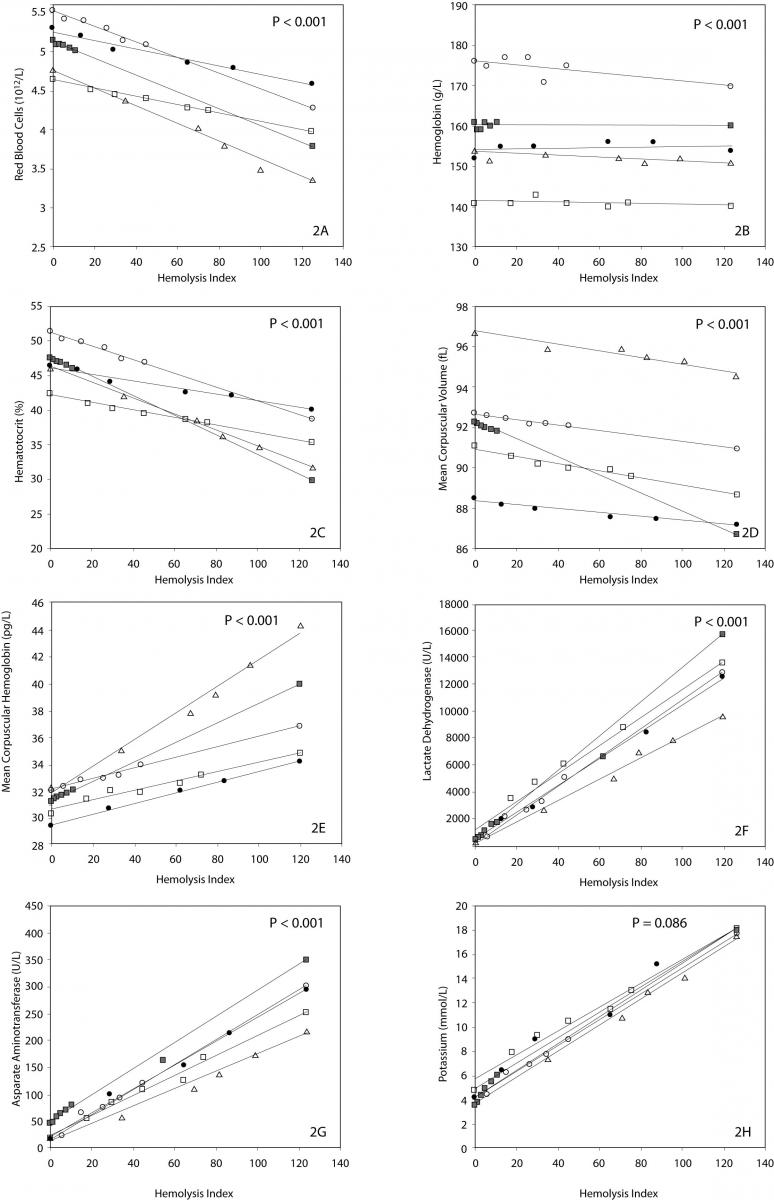
Figure 2. Linear regression analysis between hemolysis index (HI) and red blood cell count (2A), hemoglobin (2B), hematocrit (2C), MCV (2D), MCH (2E), LD (2F), AST (2G) and potassium (2H).
Discussion
Hemolyzed specimens represent a crucial issue in laboratory diagnostics, both for the high frequency and for the important interference that cell-free hemoglobin, other intracellular components and cellular debris exert on a variety of clinical chemistry (28), coagulation (29), and immunochemistry assays (7), as well as on arterial blood gas analysis (30). Moreover, since hemolyzed specimens are often an important cause of relational, economical and organizational problems between laboratory professionals and physicians, especially those working in the emergency department (10), some corrective formulas have been proposed, since this might be beneficial for early triage and decision making, and further harmonizing professional relationships. At least hypothetically, when the lower bound of the predicted bias would provide a roughly acceptable value (i.e., within the reference range), the collection of a second sample might be unnecessary. In these specifically reported equations, the concentration of the analyte is multiplied by the slope obtained from a linear regression analysis between the bias observed at different cell-free hemoglobin concentrations, as assessed by either the cyanmethemoglobin assay (12,13), or the HI (15-17). Brescia et al. suggested an additional approach, where the analyte (i.e., potassium) released by lyzed RBCs is estimated from a formula including the MCHC along with cell-free hemoglobin (18). There are however several theoretical reasons proposed against the use of such formulas, which include (i) the large heterogeneity of the different formulas which prevents their interchangeability among different local conditions of instrumentation, assay and sample matrix (e.g., serum or plasma), (ii) the potentially broad interindividual variability of most intracellular constituents (e.g., potassium, LD and AST), and (iii) the misleading information about the biochemical profile in the presence of hemolytic anemia. While the last two aspects are virtually incontestable, the aim of this experiment was to verify whether also the third assumption was valid, thereby arguing definitively against the use of these equations.
Taken together, our results support the hypothesis that a dishomogenous interindividual behavior of clinical chemistry and hematological parameters exists following mechanical trauma of blood, so that the different tests could be essentially classified according to five patterns, as shown in figure 3, i.e., unaffected, homogenous interindividual variation and non clinically significant bias, heterogeneous interindividual variation and non clinically significant bias, homogenous interindividual variation and clinically significant bias, heterogeneous interindividual variation and clinically significant bias. The first and the second would reasonably reflect the ideal conditions. In the first case, the results might be safely released to the clinicians since the bias caused by blood cell lysis is virtually inappreciable. The second case might also be similarly handled, since the homogeneous interindividual variation of results and the lack of a clinically significant bias would allow the use of corrective formulas, calculated according to the concentration of cell-free hemoglobin in the sample to permit adjustment of test results accordingly. The three other conditions would instead lead to suppression of all test results and blinding of these to the clinicians since (i) one corrective formula would not be adequate for all cases in the presence of a high degree of interindividual variation of results, or (ii) the correction of results by any corrective equation would hypothetically produce an estimated value that exceeds clinical significance and would thereby be unreliable or misleading.
According to our results, hemoglobin and glucose fell within the first category, so that test results on hemolyzed specimens might be reliable regardless of the concentration of cell-free hemoglobin in the specimen (Figure 3). No parameter tested fell within the second category, i.e., displayed a homogenous interindividual variation and a non clinically significant bias that would permit the calculation of an analyte-specific, universal, corrective formula for each analyte to accurately estimate test results. Conversely, all remaining test parameters could be classified within the other three categories, where the use of an equation formula would be misleading due to the large interindividual variability of the values (RBC count, hematocrit, MCV and MCH), or the imprecise estimation since the percentage bias of the sy,x exceeded the quality specifications for desirable bias derived from biologic variation (i.e., potassium), or both aspects (platelet count, WBC count, LD and AST) (Figure 3) (26). In clinical practice, this implies that (i) the values of RBC count, hematocrit, MCV and MCH in hemolyzed specimens might be reliably predicted by a HI-based equation, which should however be individualized (i.e., separate equation for each patient); (ii) a common formula might be developed for predicting potassium values according to the HI, but the calculated value would not be sufficiently accurate to be clinically usable, and (iii) the values of platelet count, WBC count, LD and AST cannot be accurately predicted from the HI, nor can a common equation be identified. These results, at least for potassium, are in keeping with those of Shepherd et al., who correlated the bias between potassium in the hemolyzed and non-hemolyzed repeated samples with the HI (31). These workers also observed a significant linear relationship, mirrored by a 0.16 mmol/L potassium increase for each increment of the HI. Nevertheless, in agreement with our results, they observed a wide bias in potassium values calculated from the expected equation (i.e., ± 0.4 mmol/L vs. ± 0.5 mmol/L in our study), concluding that the magnitude of this variation was too excessive to recommend the use of the HI to predict potassium concentration in hemolyzed specimens.
Figure 3. Classification of hematological and clinical chemistry results in hemolyzed specimens.
WBC - white blood cells; RBC - red blood cells; Hb - hemoglobin; Ht – hematocrit; MCV - mean corpuscular volume; MCH - mean corpuscular hemoglobin; Plt – platelets; LD -lactate dehydrogenase; AST - aspartate aminotransferase.
Despite the limited number of subjects investigated, all the trends were however consistent. As such, an additional and important aspect that we observed in this study is that - although a similar pattern of RBCs lysis was observed among the study population – the slopes were statistically different one from the other, indicating that the different subjects were characterized by heterogeneous erythrocyte fragility. Interestingly, the slope of the RBCs equation was reliably predicted by the baseline MCV value (r = -0.901; P = 0.037), thereby suggesting that the differential degree of RBCs breakdown might at least partially depend upon the initial size of the erythrocytes, where the RBCs of subjects with smaller MCV tend to be more resistant to the mechanical lysis than those of subjects with a greater MCV. Unpredictable patterns were also observed for platelet count and WBC. While the results of the former parameter were dramatically unreliable, increasing progressively in parallel with the increase of the HI due to the well known interference from damaged blood cells and their cytoplasmic fragments in platelet enumeration and sizing (32), the behavior of WBC was roughly similar among the different individuals, displaying a significant inverse relationship with the HI and thereby confirming that WBCs other than RBCs might be dramatically injured in hemolyzed specimens.
In conclusion, the results of our investigation attest that the mechanical injury of the blood, as it might occur during flawed or mishandled procedures for collecting and handling blood specimens, does not occur homogeneously nor sufficiently predictably among different subjects, so that the use of corrective formulas to adjust and release test results on these samples is unreliable and likely to be even misleading.