Introduction
Analytical interference is a deviation from the true value of the analyte caused by presence of some endogenous or exogenous substance (1). In the clinical laboratory setting, interferences can be a significant source of laboratory errors with potential to cause serious harm for the patient (2). Unlike for hemolysis which is recognized as one of the leading causes of preanalytical interference (3), in the recent literature reports, lipemia is often overlooked. The overall frequency of lipemic samples ranges from 0.5-2.5%, depending on the type of hospital and proportion of inpatient and outpatient samples (4-6). Analysis of preanalytical errors in our laboratory revealed low frequency of lipemic samples (less than 0.5%) (5). However, in the outpatient unit, lipemia was the leading cause of unsuitable samples with the frequency almost 4-fold higher than in hospital patients (5). Although certain proportion of the lipemic samples in the laboratory originates from various pathophysiological conditions (e.g. multiple myeloma, diabetes mellitus, acute pancreatitis, kidney failure or hypothyreosis), some preanalytical factors significantly contribute to lipemia. The recognition and management of these issues is a major area for improvement in order to minimise laboratory errors (7,8).
This article presents an overview on preanalytical causes of lipemia, mechanisms of action, methods of detection, methods of lipemia removal and investigation of lipemia in interference studies.
Causes of lipemia
Lipemia is a turbidity of the sample caused by accumulation of lipoprotein particles. As lipoproteins vary in sizes, not all classes contribute equally to the turbidity. The largest particles, chylomicrons, with sample size of 70-1000 nm, have the greatest potential in causing turbidity of the sample. Accumulation of small particles, high density lipoproteins (HDL), low density lipoproteins (LDL) and small very low density lipoproteins (VLDL) doesn’t result with lipemic samples (Figure 1) (9).
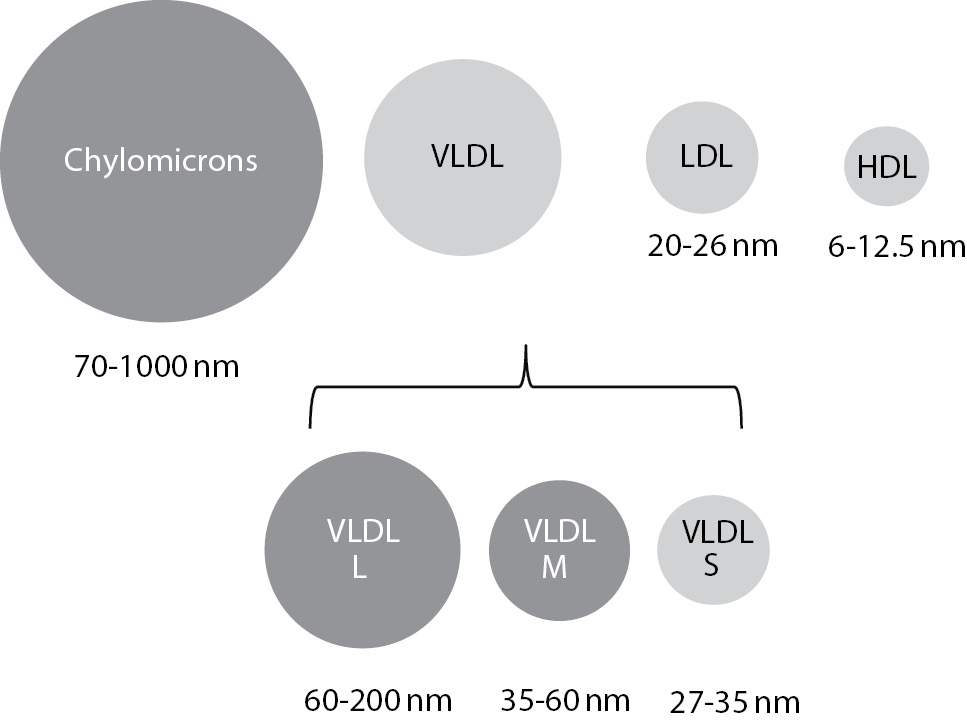
Figure 1. Lipoprotein particle sizes and lipemia.
Lipoproteins that are coloured dark grey cause turbidity of the sample. VLDL – very low density lipoproteins (L – large; M - medium; S – small), LDL - low density lipoproteins; HDL - high density lipoproteins.
The most common preanalytical cause of lipemia is inadequate time of blood sampling after the meal. In the hospital setting a certain proportion of lipemic samples can’t be avoided, since patients are admitted to the emergency services in various times of the day and various intervals since their last meal. However, outpatients that are arriving to laboratory for appointed laboratory testing, should be properly prepared and fasting prior to blood sampling. Some laboratories instruct their patients that they should be fasting only for those tests for which values will be influenced by food intake, like glucose, lipids or calcium. However, even though values of a certain parameters will not be changed after the meal, postprandial lipemia of the sample can be the cause of the laboratory error. Possibly the best example for this fact is prothrombin time (PT), that can’t be determined by optic agregometry in grossly lipemic samples, even if the meal itself doesn’t induce the change in the PT value (10).
Results of a recently published article by Kackov and Simundic on outpatient preparation for blood sampling, revealed interesting results (11). When asked if they were fasting, 93% (140/150) of the surveyed patients confirmed. However, when asked to explain the meaning of the fasting state, only 58 out of 150 patients were able to properly identify the fasting state as it is defined in Croatia by national recommendations as 12 hours fast after the last meal (12,13). Most of the 82 patients who wrongly believed that their preparation for fasting state was adequate, believed that the exact time that has to pass since the last meal does not matter. In addition, 5 patients believed that at least 10 hours has to pass and 13 patients believed that at least 8 hours has to pass since the last meal prior to blood sampling (11).
There is a large heterogeneity in instructions for patient preparation for the laboratory testing. Based on the results of a recently published article by Working Group on the Preanalytical Phase in the European Federation of Clinical Chemistry and Laboratory Medicine (EFLM), the time that has to pass from the last meal varies between countries (14). Italian recommendations require that patient has to fast for at least 8 hours, while Australian require up to 10-16 hours fast prior to laboratory testing for lipid status. Therefore, Simundic at al. propose that effort should be put in harmonisation of instructions on patient preparation and dissemination of that information to both, patients and clinicians (14). Patients are not properly informed on how to prepare for laboratory testing, general practitioners and nurses do not provide enough information and it is usually too late when patient comes to laboratory.
In the hospital patients, lipemia can also be caused by sampling too soon after administration of parenteral lipid emulsions. These preparations (Intralipid®, Fresenius Kabi, Germany and Ivelip®, Baxter Healthcare Corporation, Belgium) are used as total parenteral nutrition for neonates (15) or patients in intensive care units (16). Recent literature findings describe cases of lipemia, which interfered with laboratory analysis, after prolonged use of Intralipid as an antidote in lipofilic drugs poisoning (17,18). If it is possible, in order to avoid lipemia, the sample has to be taken at least 5-6 hours after administration of Intralipid (19).
Mechanisms of lipemia interference
Physical and chemical interference
Accumulation of lipoproteins in the patient sample can interfere with measured analytes by physical and chemical interactions. This is especially important in electrophoretic methods. Bossuyt et al. have described lipemia interference in capillary electrophoresis of serum proteins (20). When analyzing patient samples with increased concentration of triglycerides, they detected an abnormal morphology of the alpha-2-globulin fraction. They have also replicated that finding when spiking native samples with sample containing high concentration of triglycerides. The peak height correlated with the triglyceride concentration suggesting that the interference was present in a dose-dependent manner.
Lipemia can also non-specifically interfere in various immunoassays. Lipoproteins can interfere with antigen-antibody reaction by blocking binding sites on antibodies. This can happen even when antibodies are bound to a solid surface. Depending on the nature of the reaction, the interference can cause both, falsely elevated or falsely decreased result (21).
Interference in spectrophotometric methods
This mechanism is probably the most common way in which lipemia affects results of laboratory tests. Lipoprotein particles in the sample can absorb light. The amount of absorbed light is inversely proportional to the wavelength and decreases from 300 to 700 nm, with no specific absorption peaks in between (22). Therefore, methods that use lower wavelengths are more affected by lipemia, because the absorbance is the highest in that part of the spectra. Many clinical chemistry methods (like alanine aminotranspherase, ALT; aspartate aminotranspherase, AST; glucose) use reaction NAD(P)+ « NAD(P)H + H+ as an indicator reaction for determining concentration or activity of the analyte. Since the change of absorbance is measured at 340 nm, most of these methods are strongly affected by lipemia.
The direction and the magnitude of lipemia interference in spectrophotometric methods depend on the wavelength of the reaction, the direction of the reaction (is an indicator reaction measuring increase or decrease of absorbance) and blanking of the method (23). It is therefore possible that the direction and the extent of interference will differ when comparing different methods for the same parameter. This was confirmed in our recently published study (24). We have investigated influence of Intralipid induced lipemia on several clinical chemistry tests using reagents and analytical platforms from three manufacturers (Cobas® 6000 <c501> by Roche, AU680 by Beckman Coulter and Dimension Vista System by Siemens). For some of the tested parameters, the direction and the extent of lipemia interference was similar, e.g. all three manufacturers displayed no significant influence on CRP (C-reactive protein) concentration and significant negative influence on measurement of creatinine. However, the results differed significantly for bilirubin concentration measurement. Siemens reagent (diazo-reaction) displayed strong positive, Roche reagent (DPD - dichlorophenyldiazonium tetrafluoroborate) strong negative bias, while Beckman Coulter method (also DPD) was hardly at all affected by lipemia (24). Other authors have also found differences in extent of lipemia interference between different reagents for bilirubin determination (25,26). The influence of lipemia differs between manufacturers even if the same methodology is used. Meany et al. present results of significantly different lipemia influence on salicilate and acetaminophen concentration determination by two manufacturers (Roche Diagnostics and Stanbio Laboratories) using the same enzymatic methodology (27).
Non-homogeneity of the sample
For obtaining serum or plasma for analyte measurement, blood needs to be centrifuged. After centrifugation, particles distribute according to their density: chylomicrons and VLDL particles have low density and will therefore be located at the top of the tube, forming a distinct layer. Constituents in the plasma distribute between layers depending on their polarity: hydrophobic analytes are distributed in the lipid phase. Therefore, analytes soluble in the aqueous phase (small molecules, electrolytes) will not be present in the upper part of the tube. When sampling for measurement, most analysers obtain sample from the upper part of the tube, using sensors to prevent the needle from going too deep into the tube. This can result with falsely decreased concentration of electrolytes and metabolites. The opposite is valid for polar substances (some drugs, like valproic acid or steroid hormones). These analytes will accumulate in the upper lipid layer, and their concentration will be falsely decreased in the lower part of the tube.
Volume displacement effect
This mechanism strongly affects concentration of electrolytes. The normal plasma consists of approximately 92% of water and 8% of lipids. In the lipemic sample, the proportion of lipid phase increases and can be up to 25%. Analytes that are not distributed in the lipid phase (i.e. electrolytes) are distributed in the aqueous part of the sample, which now accounts for only 75% of the sample. Methods that measure concentration of electrolytes in the total plasma volume (including the lipid phase), like flame photometry or indirect potentiometry, result with falsely decreased concentration of electrolytes because of the high dilution prior to analysis. Multiplying obtained result after the measurement to the full plasma volume, results with an error in electrolyte concentration. This effect is noticed at grossly lipemic samples (over 17 mmol/L of triglycerides) (28). Methods that are measuring concentration of electrolytes only in the water phase without dilution (direct potentiometry), measure the true concentration and are not affected by lipemia. Results of electrolyte concentration measurement are similar by using direct and indirect potentiometry, if there is no disturbance of the water phase in the sample, the differences between methods correlate with the degree of lipemia (29-31).
Detection of lipemia
Visual detection
Visual detection of lipemia in the patient samples is still widely used approach, especially in the laboratories with low number of samples. Lipemia can be detected visually if the concentration of triglycerides in patient sample is over 3.4 mmol/L (32). In the full blood samples, visual detection is very hard and can be observed at much higher concentration of triglycerides (over 11.3 mmol/L) (32). Because of that, lipemia of the full blood sample often remains undetected. This was recently demonstrated by Salvagno et al. in a research to determine frequency of lipemia in full blood arterial samples received to laboratory for blood gas analysis (33). By measuring the lipemic index, they have discovered 11% (52/478) of lipemic samples. Lipemia of these samples was not detected visually when samples were analyzed, but only by measuring L Index. Visual detection of lipemia in the serum gives highly heterogeneous results. In our study of methods of lipemia detection, we have discovered only moderate degree of agreement between 6 laboratory technicians in visual detection of lipemia (Weighted kappa coefficient, Κ = 0.70 (95% CI = 0.63–0.77) (34). The results might even be worse, if a larger number of laboratory staff is involved in the process. Moreover, the degree of comparability with automatic detection using lipemic index was even lower (Κ = 0.56, 95% CI = 0.42–0.69), proving that visual inspection is inadequate method for the detection of lipemia in the sample (34).
Triglyceride concentration measurement
Some laboratories include triglyceride concentration measurement in a rough assessment of degree of lipemia. However, this approach also has a few shortcomings. The proportion of triglycerides differs among lipoprotein subclasses and ranges between approximately 50% in VLDL particles up to 85-90% in chylomicrons. Thus, the degree of turbidity does not correlate well with the triglyceride concentration. Twomey et al. confirmed this in an experiment where they demonstrated a linear agreement between triglyceride concentration and lipemic index when lipemia was simulated by an addition of standardized lipemic emulsion (Ivelip) (r2 for Deming regression = 0.9994) (35). However, when lipemic index was correlated with triglyceride concentrations in patient sample, for both, visually turbid and non-turbid sample, the agreement was much lower (r2 = 0.2399 and 0.7795, respectively).
Most reagents for the triglyceride concentration measurement use the enzymatic method based on glycerol oxidation to dihydroxyacetone phosphate. Concentration of triglycerides is proportional to the rate of glycerol oxidation. Therefore, an increased amount of glycerol in the sample will result with falsely increased concentration of triglycerides. Several cases of pseudo-hypertriglyceridemia, because of both, exogenous or endogenous accumulation of glycerol, have been described in the literature. Speeckaert MM et al. have reported a case of patient with high triglyceride concentration (11.3 mmol/L) and very low lipemic index (36). An increased osmotic gap implied an accumulation of the osmotic active molecule and patient history revealed excessive intake of beer containing large amount of glycerol. In addition, there are genetic causes of glycerol accumulation like mutations in the glycerol kinase gene causing glycerol kinase deficiency (37). In patients with this disorder, triglyceride concentration cannot be measured accurately using glycerol-based methods. Although there is a large body of evidence that triglyceride concentration measurement is not an ideal way of assessing lipemia, it still has some useful practical application. De Haene et al. have demonstrated an importance of triglyceride concentration measurement in combination with the lipemic index, since calculation of triglyceride to L-index ratio might help in discriminating between several causes of lipoprotein disorders, abnormalities in glycerol and triglyceride metabolism and preanalytical errors due to non-fasting state (38).
Automatic detection – L-index
Nowadays, most analytical platforms utilize automatic detection and assessment of the degree of lipemia. The method is based on dilution of the sample in the saline or buffer and measurement of spectra in a wide range of wavelengths. As mentioned previously, lipemic samples absorb light between 300-700 nm. Though overlapping with spectra of bilirubin and haemoglobin for measuring icteric and hemolytic index in the lower wavelengths area, only lipemic samples absorb light around 700 nm, and therefore those wavelengths are used to assess the degree of lipemia. Absorbance is proportional to the amount of lipids in the sample. There is a still large heterogeneity between manufacturers in wavelengths used, however almost all of them use combinations or two or more wavelengths. For example, on the AU series (former Olympus) Beckman Coulter uses 660/800 nm, on Cobas series, Roche uses 660/700 nm and on Architect platforms Abbott uses several wavelengths (510/524; 572/604; 628/660 and 524/804) in a calculation of the degree of lipemia.
Advantages of automatic detection are low cost, high speed, increased reproducibility and shortening of turn-around-time. However, there are also some disadvantages.
False positive results can occur in the presence of sample turbidity that is not caused by accumulation of lipids, but by other molecules. There are several articles describing falsely elevated L-index with low lipid values in the case when paraproteins are present in the sample (39,40). These articles even emphasise clinical usefulness of lipemia index measurement in detecting M-protein in otherwise asymptomatic patients. In addition, a false positive result has been observed in the presence of a contrast dye (Patient Blue V dye used during cancer surgery) (41). In such cases of clinically unclear results, unusually high lipid index that is not corresponding to the clinical features of the patient, an additional visual inspection of the sample might help in determining the origin of turbidity.
Another issue regarding automatic detection of lipemia is a lack of standardization among manufactures in reporting L-index values. Some use semi quantitative, while other use almost fully qualitative scales. Depending on the platform used, Beckman Coulter expresses its results for L-index from 0 to 5 (10), and Siemens from 1 to 6 (8), while Abbott and Roche use continuous scales that correspond to the Intralipid concentration used in the simulation studies. Both of these approaches have advantages; semi quantitative scale correlates better with the visual inspection of the sample, while continuous scale gives a better correlation between the intensity of interference and the effect on the measured result. Because of these issues, though significantly standardizing intra-laboratory assessment of lipemia, L-index cannot be compared between different manufacturer’s platforms and therefore harmonisation is needed in this area.
In addition, reagent for determining lipemic index is a laboratory reagent like any other, and prior to implementation to routine laboratory practise has to be validated. A Clinical Laboratory Standards Institute guideline CLSI C56-A (Hemolysis, Icterus, and Lipemia/Turbidity Indices as Indicators of Interference in Clinical Laboratory Analysis) gives detailed instructions of this practise (42). An internal quality control has to be performed daily. Since there are not available commercially samples, a laboratory should prepare its own standards of either patient lipemic samples or samples spiked with synthetic lipid emulsions.
Lipemia removal
In most cases, lipemia can be removed from the sample and measurement can be done in a clear sample without interferences. There are several ways of removing lipids, and laboratory experts should carefully choose which one to use depending on the tests that have to be measured in the sample.
Centrifugation
A recommended procedure for treating lipemic samples is centrifugation using ultracentrifuge which effectively removes lipids and allows measurement of large number of analytes (42,43). However, due to the high cost, this equipment it is not available in a large number of laboratories. Ultracentrifuge can obtain forces up to 100,000–2.000,000 x g. In his recently published article, Dimeski et al. have proven that high speed centrifuge with force of 10,000 x g can be almost as efficient as ultracentrifuge in removing lipid layer (44). However, centrifuges generating lower forces will only be efficient in clearing the sample if the lipemia is caused by accumulation of larger particles, chylomicrons. If lipemia is caused by accumulation of VLDL particles, process is less effective and centrifugation has to be repeated several times in order to obtain a clear sample.
After centrifugation, a lipid layer on the top of the tube is removed and measurement is done in infranatant. This approach is, therefore, not acceptable for measurement of hormones, drugs and other hydrophobic substances, since they will be distributed in the lipid layer, and measurement in the infranatant will cause falsely decreased result.
Extraction
Lipids can be extracted using polar solvents. Some laboratories still use manual protocols with polyethylene glycol or cyclodextrin (45), while this principle is now utilized in commercially available kits. Based on the literature reports, product Lipoclear (StatSpin®, Norwood, MA, USA) is widely used. The reagent contains non-toxic, non-ionic polymer that binds lipids (46). After centrifugation, these particles are precipitated at the bottom of the tube, and measurement is performed in a clear supernatant. Although this is a very fast and efficient way of removing lipids, which does not require any special equipment, it still cannot be used for all parameters. While manufacturers report that only inorganic phosphates have low recovery (47); other investigators identified several other unacceptable analytes in verification studies. Vermeer et al. found following parameters to have recovery lower than 85%: GGT – gamma-glutamyltransferase, CK-MB – creatine kinase MB isoenzyme and CRP (using Beckman Coulter reagents), and therefore can’t be measured in the sample after treatment with Lipoclear reagent (48). Recovery lower than 85% was also confirmed for the same parameters in a recently published article by Saracevic at al. (49). This study additionally revealed unacceptably high recovery for troponin T (124.7 and 121.5% for 300 and 500 mg/dL of added Intralipid concentration), indicating that Lipoclear cannot be used for clearing samples when this parameter has to be measured. The reason of such discrepancy between manufacturer’s declarations and verification studies might be that the manufacturer has tested the effect of addition of Lipoclear into the clear sample, while two mentioned studies performed recovery experiments in the lipemic samples.
Sample dilution
For analytes distributed in the lipid layer, methods that remove lipid fraction are not acceptable. In such cases, measurement can be done in a diluted patient sample. Sample can be diluted only enough to remove the turbidity interference, but not too much to make sure that analyte concentration remains within the analytical limits of the tested methods (2 or 3 fold). This is probably the best approach for measurement of therapeutic drugs in lipemic samples.
Interference testing
Interference testing is an obligation of manufacturers of laboratory reagents. Influence of interfering substance can be tested in two ways. The best approach would include comparison of the tested method with the reference method, i.e. the one on which lipemia has no influence. Interference by lipemia would then be assessed by comparing results and calculating bias between two methods. However, for lipemic samples, interference-free methods are not widely available, therefore interference of lipemia has to be quantified using different approach. This includes spiking of native sample with some interferent, in order to create lipemic sample. The interferent is added in increased concentrations and bias calculated for each one. The results are presented graphically on interferograms, with an increasing concentration on the interferent added on the x-axis, and bias in comparison to the original result on the y-axis (Figure 2) (50,51).
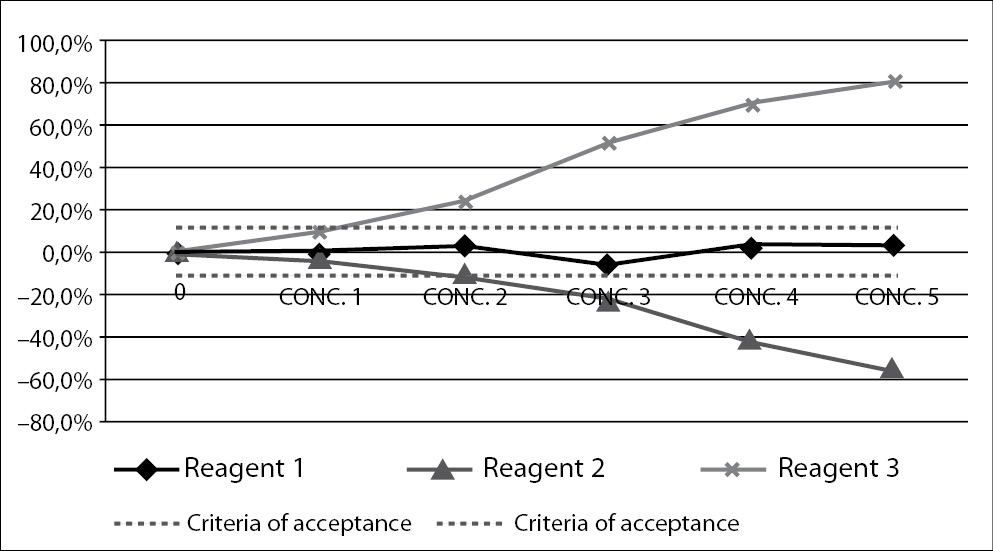
Figure 2. Interferogram – a graphical presentation of interference.
Figure presents measurement of interference for three different reagents (Reagent 1, Reagent 2 and Reagent 3). Increasing concentrations of interferent are presented on x-axis, and measured bias on y-axis. Dashed lines present criteria of acceptance. A point where the full line intercepts the dashed line is highest accepted concentration of interferent.
The choice of interferent is problematic for lipemic samples. Patient lipemic samples or standardized solutions containing lipids can be used. Though the use of patient sample would better mimic pathophysiologically induced lipemia, it is not ideal due to heterogeneity of lipemic samples. Such study could hardly be replicated, because, though sharing the same lipemic index or concentration of triglycerides, the composition of lipoprotein particles differs in two lipemic samples. It is therefore currently recommended to use standardized solutions containing lipids of known concentration and composition (42,51).
The most widely used product is Intralipid (Fresenius Kabi AB, Uppsala, Sweden). It is an emulsion used for intravenous administration as a source of calories and essential fatty acids (19). The product can be obtained as 10% or 20% solution mixture of soybean oil, egg yolk phospholipids and glycerine. Intralipid containes triglycerides of linoleic, oleic, palmitic, linolenic and stearic acid. The problem with Intralipid lies in its particle size. Intralipid particles range from 200 nm to 600 nm, with mean size of 345 nm and are smaller than large chylomicrons (up to 1000 nm), and bigger than medium and large VLDL particles (35-200 nm). Therefore, effects created by addition of Intralipid into the sample are not identical with the pathophysiologically induced lipemia in the patient sample. This was first observed over two decades ago, when Nanji et al. obtained differences in analyte concentration in quality control samples spiked with Intralipid and patient serum containing the same concentration of triglycerides (52). Bronhorst et al. conducted the methodologically more convincing experiment in the year 2004 (53). He has used patient lipemic samples to determine concentrations of several specific proteins: alpha-1-antitripsin, ceruloplasmin, haptoglobin, prealbumin and transferrin. The extent of lipemia was determined by measurement of L-index on Modular Analytics P 800 analyzer (Roche). Samples were then ultracentrifuged in order to remove lipemia interference. The concentrations of ceruloplasmin, prealbumin and transferrin were significantly different in the cleared samples, indicating strong influence of patient lipemia on the results of these tests. However, when he has recreated lipemic samples of the same lipemic index by adding Intralipid solution, the concentrations of measured proteins did not change significantly. This article is extremely important in understanding that Intralipid interference studies cannot always be transferred to the clinical conditions and do not always correlate with lipemia in the patient sample. However, since in clinical hospitals, especially in the intensive care and neonatal units, lipemia of the samples sometimes originates from intravenously applied Intralipid solution, Intralipid spiking studies are still very valuable source of information on lipemia interference.
As proposed by CLSI guidelines (42,51), manufacturers should report to their users a detailed information about the interference study: materials used for simulation of lipemic samples, interferent concentrations, concentrations of measured analytes and determined bias. If there is no interference, the highest tested concentration of interferent should be declared. If interference is present, the lowest concentration of interferent causing a significant bias has to be reported. However, there is no consensus on what is a significant bias. Manufacturers sometimes use value of 2 x standard deviation as significant bias, referring to the fact that interference is significant if it is larger than the analytical error of the instrument. In addition, many studies use intraindividual coefficient of variation (CVw), or 0.5 x CVw as desirable specification for imprecision (54). According to the concept of total error, allowable bias for interference can be calculated as I = CVW - (1.96 x CVa) – B; where CVa is an analytical coefficient of variation, and B is bias of the method (55). Depending on the clinical use of the laboratory test, the laboratory manager can choose each of these concepts, since each of them recognizes specificities of particular analyte and modifies criteria accordingly. The acceptance criteria for interference will not be the same for the analytes with different biological variation and analytical performance. A careful consideration and expert opinion are required to establish acceptance criteria, like done in an article by Steen et al. (56). Grunbaum et al. used criteria based on both, analytical and biological variation (57). Analytically significant changes should always be compared to the clinically relevant criteria. It is therefore unacceptable that some manufacturers use arbitrary values (10% or 20%) for allowable bias for interference for all analytes. This concept of arbitrary values has been used in the past (1,4), but should now be abandoned in favour of evidence based criteria. Arbitrary cut-off values make interpretation of results from some studies very difficult. When trying to verify manufacturer’s claims for the Roche Cobas 6000 assays regarding lipemia, Ji JZ et al. have used the same criteria of acceptance as the manufacturer (58). That criterion is 10%. They did not confirm all manufacturers’ claims with some analytes overrating, and some underrating the lipemia influence. However, not only that the criterion used is inadequate, the authors did not report the concentrations of measured analytes and the exact values of the measured bias, which makes their results non-applicable for other readers. These issues were also addressed by Szoke et al. in their Letter to the editor emphasizing importance of using evidence based criteria based on biological variation (59). Therefore, manufacturers should revise their current stand on declaring data for interference. They should report data in more details, with as many information as possible and with an acceptance criteria adjusted for the tests based on biological variation.
Moreover, manufacturer’s data are not always confirmed in a laboratory practise. This was demonstrated in our previously mentioned article, where we have discovered that manufacturer’s claims were confirmed only for 11 out of 24 tested analytes for Beckman Coulter, for 20/23 for Roche and 16/22 for Siemens. Though appearing that Beckman Coulter seriously misreported their data on lipemia interference, these results are misleading since the other two manufacturers used generally larger acceptance criteria (24).
In summary, lipemia interference, though not under the spotlight due to the low frequency, is a significant source of laboratory errors. Each laboratory should be aware of the influence that lipemia can have on the results of the laboratory tests. A verification of manufacturer’s claims should be done in a laboratory using evidence based criteria of acceptance. In addition, written procedures for detection of lipemia, removing lipemia interference and reporting results from lipemic samples should be available to laboratory staff in order to standardize the procedure, reduce errors and increase patient safety. We propose a flowchart for management of lipemic samples (Figure 3).
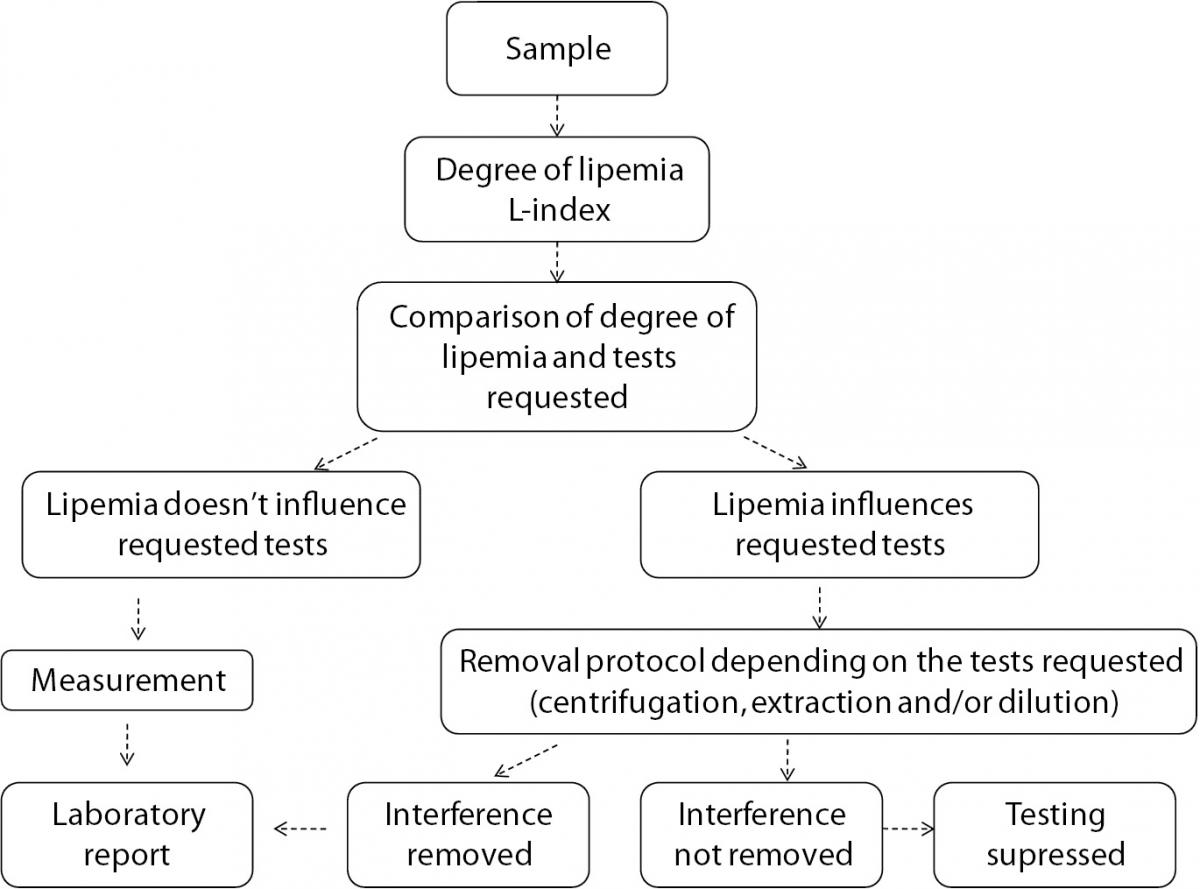
Figure 3. Flowchart for management of lipemic samples.
Acknowledgment
This study was supported by Ministry of Science, Education and Sports, Republic of Croatia, project #134-1340227-0200.