Introduction
Blood, urine and cerebrospinal fluid are standard samples analyzed in the clinical laboratory. However, occasionally the evaluation of serous extravascular fluids (i.e. pleural, peritoneal and pericardial) is requested. Biochemical analysis of such samples can provide the clinician valuable information about the fluid’s etiology and refer him to final diagnosis and treatment options.
Pleural effusions
Pleural effusions result from excessive fluid formation and its accumulation in the pleural space. The most common conditions causing pleural effusions are heart failure, malignancy, pneumonia, tuberculosis and pulmonary embolism. In patients presenting with pleural effusions, efforts should be made to find out the cause so that appropriate treatment can be instituted (1,2).
Patient history and physical examination are crucial for the clinical evaluation of pleural effusions. They are followed by confirmation of pleural effusion presence using radiological or/and ultrasound studies or computed tomography (CT) chest scans. Thoracentesis, the removal of pleural fluid using a needle or syringe, is performed either for diagnostic or therapeutic purposes. It should be coupled with blood sampling (within 30 minutes from obtaining the pleural fluid sample) needed for further effusion evaluation, i.e. the differentiation of transudative from exudative effusions (3).
In most cases of pleural effusions, especially if no underlying diagnosis is apparent, biochemical analyses provide important diagnostic information. Various tests can be performed for pleural fluid (PF) analysis, either as sole or additional diagnostic tools to further determine the effusion’s etiology (4,5).
Appearance of pleural fluid
Although fluid appearance is a nonspecific tool in the evaluation of PF it can provide useful information about the etiology of pleural effusion.
Most transudates and many exudates are clear, straw-colored, odorless and non-viscous fluids (6). A homogeneous bloody appearance, with PF hematocrit of 1-20% of peripheral, narrows the differential diagnosis to malignancy, embolism or trauma. A PF hematocrit, exceeding half of the peripheral hematocrit, is indicative of hemothorax. Turbidity of PF can be caused by either the presence of cells and debris or by a high lipid concentration in PF. A clear supernatant, after centrifugation of turbid PFs, indicates that turbidity is caused by cells and debris which might indicate the presence of empyema. Otherwise, if turbidity persists after centrifugation, it is probably due to high lipid concentration, suggesting the presence of chylothorax or pseudochylothorax. Nevertheless, PF triglyceride analysis is a more definitive test and concentrations > 1.2 mmol/L indicate that the PF is chyle. An anchovy-brown fluid may indicate amebic liver abscess while black fluid suggests Aspergillus infection (4,5,7).
Differentiation of exudates from transudates
The initial step in the biochemical evaluation of pleural effusions is to determine whether they are transudative or exudative (Figure 1). Transudative pleural effusions are caused by systemic non-inflammatory conditions such as heart failure and cirrhosis. They respond to treatment of underlying disease. Exudative effusions are caused by an inflammatory or malignant process affecting the pleura, causing increased capillary permeability and fluid accumulation. Common causes of exudates include pneumonia, cancer, tuberculosis and pulmonary embolism. An extensive diagnostic investigation is required to determine a definite diagnosis (1,5).
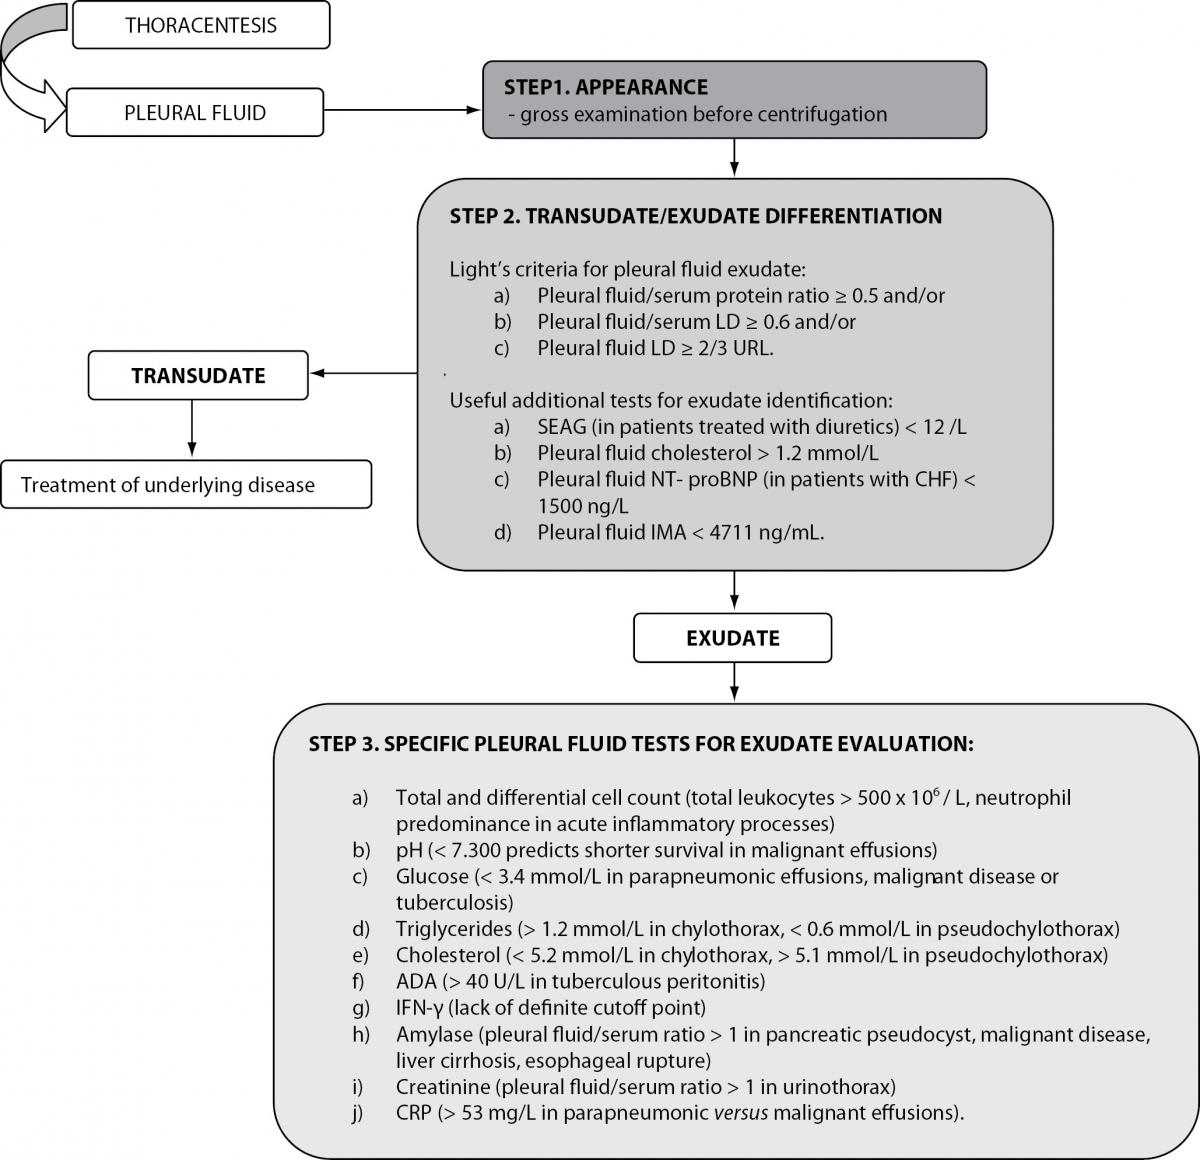
Figure 1. Biochemical analysis of pleural effusions.
LD – lactate dehydrogenase; URL – upper reference limit of serum LD; SEAG – serum effusion albumin gradient; NT-proBNP- N-terminal brain natriuretic peptide precursor; CHF – congestive heart failure; IMA- ischemia-modified albumin; ADA – adenosine deaminase; IFN-γ - Interferon-γ; CRP – C-reactive protein.
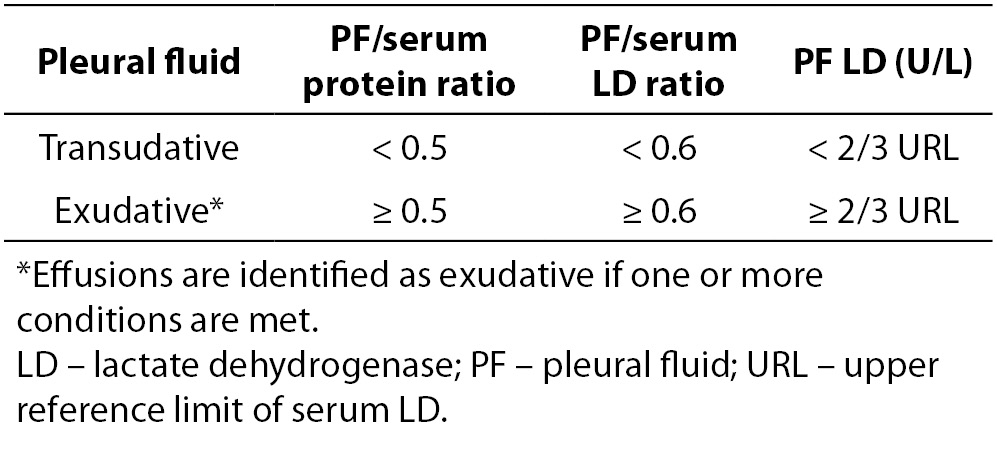
In clinical practice, Light’s criteria have been widely accepted to differentiate transudates from exudates for the past 40 years (Table 1) (6,8). In their original study Light et al. reported a sensitivity of 99% and specificity of 98% in identifying exudates. In subsequent studies, the original sensitivity of Light’s criteria was reproduced, but with lower specificities (ranging from 65% to 86%) and consequently higher misclassification rates of transudates into exudates (6,9,10). Despite this limitation, Light’s criteria were reported to be superior to clinical judgment alone in the differentiation of transudates and exudates (11).
Table 1. Light’s criteria for the differentiation of pleural effusions.
Various studies have focused on making Light’s criteria more cost-effective without affecting its diagnostic accuracy. Better diagnostic performances in comparison to Light’s criteria were obtained by quantifying exclusively PF protein and PF lactate dehydrogenase (LD) (12). An early investigation of PF cholesterol suggested that concentrations > 1.6 mmol/L were a cost-effective single test that might be used as an alternative to Light’s criteria in the differentiation of exudative from transudative effusions (13). However, these results were not corroborated by subsequent studies (14,15). Additional biochemical parameters (and their combinations) have been investigated to differentiate the two effusion types. Porcel et al. proposed measurement of cholesterol and LD in PF as an alternative to Light’s criteria for the identification of exudates without requiring blood sampling, while Costa et al. found that PF cholesterol > 1.2 mmol/L and/or PF LD > 200 U/L revealed similar diagnostic accuracy to Light’s criteria for the differentiation of PFs (16,17). Recently, concentration of ischemia-modified albumin (IMA) has been found to be increased in transudative pleural effusions compared to tuberculous effusions, and measurement of pleural IMA showed good diagnostic performances (although not superior to Light’s criteria) in transudate/exudate differentiation (18). Additional biochemical parameters have also been investigated for this purpose, including alkaline phosphatase (ALP), creatine kinase and uric acid. They showed poorer diagnostic performances compared to Light’s criteria (19).
It has been estimated that up to 25% of cardiac-related pleural effusions are misclassified as exudative in patients with congestive heart failure (CHF) due to the use of diuretics (20). Diuretic therapy in patients with CHF was reported to cause fluid shifting from the pleural space, thus elevating concentrations of various PF components, including PF protein and PF LD. Consequently, transudative pleural effusions associated with CHF could fulfill exudative diagnostic criteria (4,21). After the introduction of the serum effusion albumin gradient (SEAG), calculated as the difference between serum and PF albumin concentration, the misclassification of transudative effusions in patients treated with diuretics was significantly reduced. If SEAG is > 12 g/L, the effusion is classified as transudate. However, because of its low sensitivity, the albumin gradient should not be used individually to distinguish transudates from exudates. Thus, if the clinical appearance suggests transudative effusion, particularly in cases of CHF or cirrhosis, but the PF is exudative according to Light’s criteria, SEAG calculation is recommended (9,10,14). In recent years it has been shown that N-terminal brain natriuretic peptide precursor (NT-proBNP) concentrations are increased in PF and serum of patients with CHF and pleural effusion. Pleural fluid NT-proBNP values ≥ 1500 ng/L can differentiate pleural effusions caused by heart failure from pleural effusions caused by other etiology with sensitivity and specificity of 91% and 93%, respectively (20). Additional studies demonstrated the superiority of pleural NT-proBNP determination over Light’s criteria for the identification of cardiac-related pleural effusions. However, caution is needed when interpreting NT-proBNP results, as concentration of NT-proBNP is physiologically raised in the elderly and in patients with renal failure (22-25).
When comparing the discriminative properties of different biochemical markers for the identification of exudative effusions, the meta-analysis published by Heffner et al. should be considered. The authors confirmed that combinations of two or three tests performed only in PF specimens (i.e. the combined use of PF LD and PF cholesterol or PF LD, PF cholesterol and PF protein), showed similar diagnostic performances to modified Light’s criteria, reducing the costs of diagnosis and avoiding the need for blood sampling. Heffner et al. also demonstrated that excluding PF LD from Light’s criteria did not alter the diagnostic accuracy of the remaining combination (i.e. PF/serum LD ratio and PF/serum protein ratio). However, no superior combination of tests was proposed (26).
All of the aforementioned tests dichotomize effusions into transudative or exudative by comparing the results to a cut-off point. The diagnostic performances of each of these tests are described by means of sensitivity and specificity. Applicability of sensitivity and specificity values on individual patients in clinical practice is limited, because these measures do not describe the probability of disease if a positive test result is obtained. In addition, the combination of multiple tests, using a single cut-off point for each test, increases sensitivity but decreases specificity, implying the need for additional (and often unnecessary) tests to clarify diagnosis. A Bayesian approach addresses the limitations of binary testing by quantifying diagnostic confidence. This concept suggests that a test alone does not differentiate exudate from transudate, rather that the test only influences the pre-test probability of being a transudate or exudate. Multilevel likelihood ratios, for tests routinely performed to discriminate between transudates and exudates, were reported and can be used to estimate the post-test probability of exudative effusions. However, the familiarity and simplicity of Light’s criteria should be balanced against the introduction of new and cumbersome methods for differentiating transudates from exudates (27-29).
Evaluation of exudative effusions
Once a pleural effusion is characterized as an exudate, the next challenge is to identify its etiology. Depending on clinical presentation, exudative effusions need additional testing (Figure 1). This includes total and differential cell counts, smears and cultures to identify infection, additional biochemical testing, cytological analysis and testing for markers of tuberculous pleuritis (5,8).
In general, most exudates have > 500 x 106 / L leukocytes (30). Although differential leukocyte count in PF is of limited diagnostic value, it reflects the stage of the inflammatory response and narrows the diagnostic possibilities. Neutrophil predominance indicates an acute inflammatory process affecting the pleura that may occur in the case of parapneumonia, pulmonary embolism, viral infections, gastrointestinal diseases and tuberculous pleuritis. Predominance of mononuclear cells indicates a subacute or chronic process. Pleural lymphocytosis is indicative of malignant or tuberculous pleuritis, whereas pleural eosinophilia (at least 10% of eosinophils) is caused mainly by blood or air in the pleural space (i.e. malignancy or pneumothorax) (4,6,8).
The exudative pH ranges from 7.440 to 7.300 (30). Several conditions, such as systemic acidosis, local anesthetics entered in the pleural space or Proteus infections, can cause local alkalosis and modify the pH values of the PF. Therefore, PF pH results should always be interpreted in accordance to the clinical context. A pH value below 7.200 (and/or PF LD higher > 3 times the upper serum reference limit) in patients with parapneumonic effusion indicates the need for fluid drainage (31). A pH value below 7.300 in patients with malignant effusions predicts shorter survival and a poorer response to chemical pleurodesis. When PF pH is not available, low PF glucose concentration (< 3.4 mmol/L) indicates the presence of complicated parapneumonic effusion, malignant disease or tuberculosis (1,6,8).
Determination of triglyceride and cholesterol concentrations is useful in the diagnosis of chylothorax and pseudochylothorax. A chylothorax is defined as the accumulation of lymph or chyle in the pleural space after leak from the thoracic duct, most often due to trauma, surgery or malignancy. A pseudochylothorax results from the accumulation of cholesterol and/or lecithin and globulin rich fluid in long standing PFs. PF triglyceride concentrations > 1.2 mmol/L are confirmatory of chylothorax. Usually, PF cholesterol is determined simultaneously to exclude the presence of pseudochylothorax: concentrations < 5.2 mmol/L are associated with chylothorax. PF triglycerides < 0.6 mmol/L and PF cholesterol > 5.1 mmol/L are found in pseudochylothorax. Nevertheless, the gold standard for diagnosing chylothorax is the detection of chylomicrons in PF by means of lipoprotein analysis (22,32).
In clinical practice, the diagnosis of tuberculous pleurisy is usually established using the combination of PF microscopic examination and PF cultures. The sensitivity of these conventional methods for diagnosing tuberculous pleural effusions was reported to be less than 50%. Thus, several biochemical markers have been proposed to facilitate the diagnosis of tuberculous pleurisy. Interferon-γ (IFN-γ) and adenosine deaminase (ADA) are both released during the immune response to mycobacterial antigens in the pleura and have been extensively studied (33). IFN-γ has proven to be a sensitive and specific marker in diagnosing tuberculous pleural effusions. Investigators reported sensitivity and specificity of 89% and 97%, respectively (34,35). ADA is an enzyme involved in purine catabolism and is thought to reflect the activity of immune cells (6,34). It is released by activated lymphocytes, macrophages and neutrophils, and is considered a nonspecific marker of inflammation (36). Elevated ADA activity in PF is a sensitive and specific marker for the diagnosis of tuberculous pleuritis, particularly in high prevalence areas, with reported sensitivity of 92% and specificity of 90% at a generally accepted cut-off point of 40 U/L (37,38). Despite the high diagnostic performances of both biomarkers, ADA is commonly used in clinical practice, due to lower costs and the lack of a definite cutoff point for IFN-γ. However, since none of these PF biomarkers is specific for tuberculous pleuritis, results should be interpreted in accordance with clinical and microbiologic findings (22,33,37,38).
Additional biomarkers have been studied in the setting of tuberculous pleural effusions, including PF neopterin, leptin, lysozyme, interleukine (IL)-6, IL-1β, IL-8 and others. Variable diagnostic performances obtained and high costs preclude their introduction into routine clinical practice. To overcome the limitations of individual tests, various scoring systems, using clinical and laboratory data, have been proposed for the differentiation of tuberculous and malignant pleural effusions. They seem to perform better than any single test (36).
Cytological examination of suspected malignant PFs, although fast and efficient in cancer diagnosis, can result in false negative results in up to 40% of patients. The diagnostic performances of cytology are related to tumor type, tumor burden in the pleural space and the cytologist’s competence (1). Although single PF tumor markers such as carcinoembryonic antigen (CEA), CA 125, CA 15-3 and CYFRA 21-1 have been investigated as noninvasive procedures for diagnosing pleural malignancy, the obtained results are discordant and the usefulness limited due to low sensitivity. In an effort to improve sensitivity, combinations of tumor markers have been studied, such as CEA, CA 125 and CYFRA 21-1 or CEA, CA 15-3, CYFRA 21-1 and CA 125. It was demonstrated that such combinations could be considered valuable complementary tools in the diagnosis of malignant PF, improving the diagnostic value of PF cytology. However, the routine determination of tumor markers in the diagnosis of malignant pleural effusions is not recommended because it is not cost-effective. In cases of suspicious malignant pleural effusion and negative cytological findings, or in the absence of an obvious primary source, the determination of tumor markers may be helpful as an alternative diagnostic tool indicating the need for pleural biopsy (6,10,39,40).
High activity of amylase (AMY) in PF is defined as values exceeding the serum reference range or as PF to serum AMY ratio > 1 (22). Elevated PF AMY is found in patients with pancreatic disease and pancreatic pseudocysts, malignant disease, liver cirrhosis and esophageal rupture. The routine measurement of AMY in PFs is not useful in the absence of these indications (41,42). Increased PF creatinine concentrations (PF/serum creatinine ratio > 1) are useful in the diagnosis of urinothorax. The PF has typically transudative characteristics with marked urine odor, low glucose concentrations and low pH (10,43). Although rare, cerebrospinal fluid (CSF) can accumulate in the pleural space and result in an effusion. The presence of CSF is suggested by very low protein concentration in the PF and confirmed by β2-transferrin detection, which is normally present only in CSF (43). PF immunological tests, such as determination of antinuclear antibody (ANA) titer or rheumatoid factor (RF) levels are accessible but add little diagnostic information to serum immunological analyses (4,5,22).
Features of PF analysis that discriminate infection from inflammation in the complicated versus non-complicated setting include pleural C-reactive protein, IL-8, IL-6, tumor necrosis factor (TNF)-α and procalcitonin. Pleural CRP is higher in non-malignant versus malignant exudates, with high sensitivity and specificity for parapneumonic effusion. Further studies showed that a PF CRP cut-off value of 53 mg/L has 100% sensitivity in identifying parapneumonic versus tuberculous or malignant effusions (44). CRP measured together with IL-8 may differentiate complicated from uncomplicated parapneumonic effusions with high sensitivity and specificity (4).
Peritoneal effusions
Peritoneal effusions (or ascites) represent the pathological collection of fluid in the peritoneal cavity. Common causes include liver cirrhosis, malignancy, congestive heart failure, tuberculosis, nephrotic syndrome, pancreatic disease and dialysis (6). History and physical examination provide clues to the possible etiology of ascites formation. Abdominal radiological, ultrasound and CT studies can help detect small volumes of peritoneal fluid as well as assess the possible etiology of ascites. However, diagnostic paracentesis, i.e. the removal of peritoneal fluid, is recommended in patients presenting with new-onset ascites, requiring hospitalization due to the presence of ascites or in cases of unexplained deterioration of clinical findings (45,46). Abdominal paracentesis with appropriate ascitic fluid biochemical analysis is considered the most rapid and cost-effective method for diagnosing the cause of ascites (47).
Appearance of peritoneal fluid
Ascites is a clear, straw-colored fluid and usually reflects the presence of cirrhosis. Bloody ascitic fluid, if not caused by traumatic tap, indicates malignancy, pancreatitis or abdominal trauma. When the bloody appearance of ascitic fluid is caused by traumatic tap, the fluid tends to clear up and/or tends to clot when left to stand after paracentesis. Purulent ascites is usually caused by abdominal infection and accompanied by an increased number of polymorphonuclear (PMN) leukocytes. In conditions of complicated hemorrhagic pancreatitis, the ascitic fluid color ranges from tea-colored to black. Bile stained ascites is usually found in gallbladder or intestine perforation, cholecystitis or acute pancreatitis. Milky or turbid ascites appearance is characteristic for lymph effusions due to high triglyceride content. The turbidity of chylous ascites can be cleared by addition of a few drops of ether. Pseudochylous ascites also appears turbid but is not cleared by ether. Black colored ascites can be found in malignant melanoma (6,48).
Differentiation of exudates from transudates
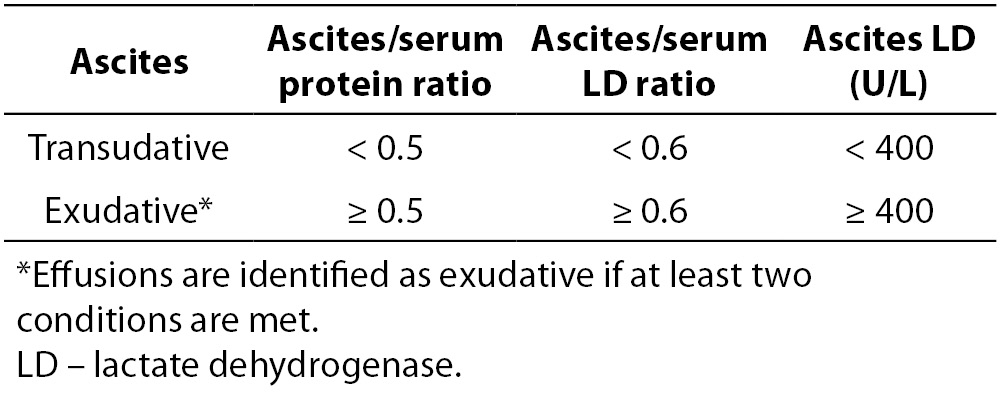
As with pleural effusion analysis, the biochemical evaluation of ascites begins with differentiation of transudative from exudative effusions (Figure 2). This concept is based on the assumption that ascites, formed by exudation from the peritoneal surface affected by inflammatory process or tumor, has high protein concentrations. Conversely, fluid formed by transudation as a result of systemic conditions such as cirrhosis, heart failure or nephrotic syndrome, has low protein concentrations (49). Ascites protein cut-off in the range of 25 to 30 g/L has been traditionally used for separating ascites into transudative or exudative. However, this approach yielded poor sensitivity and frequent misclassifications. Furthermore, it does not address ascites of mixed origin, i.e. caused by an underlying disorder besides portal hypertension. Additionally, it was observed that healthy women frequently have a peritoneal fluid protein concentration above 40 g/L, well into the exudative range. A modification of the original Light’s criteria for the identification of exudative ascites was suggested (Table 2) (6,45). Other biochemical parameters, such as ascitic/serum bilirubin ratio, ascitic cholesterol and ascitic/serum cholesterol ratio, have been investigated for the differentiation of transudative from exudative ascites, but have not been implemented into routine practice due to lack of reproducibility between studies. Furthermore, a practical model, including determinations of total protein, LD, TNF-α, complement C4 and haptoglobin in ascitic fluid, was investigated, that correctly classified 70% of unknown cases of malignant ascites (6,50,51). Although promising, these results need to be further developed in the clinical setting before implementation into routine clinical practice (51). Serum ascites albumin gradient (SAAG) has been proposed as a physiologically based alternative to the traditional classification of ascites into transudates/exudates (52). SAAG is calculated as the difference between serum and ascites albumin concentration and was demonstrated to correlate directly with measured portal pressure (6). Consequently, SAAG ≥ 11 g/L suggests the presence of portal hypertension, while SAAG values < 11 g/L are found in patients with normal portal pressure. In a large prospective study, SAAG and ascitic total protein concentration yielded a diagnostic accuracy of 97% and 56%, respectively, in the differentiation of ascites caused by portal hypertension (49). This marked difference in accuracies was explained by factors influencing these parameters: while SAAG directly correlates only with portal pressure, ascitic total protein concentrations are indirectly related to portal pressure but directly related to serum protein concentrations. In patients with cirrhosis, these influencing factors contribute variably, explaining the highly variable ascitic total protein concentration. Given the superiority of the SAAG concept, the replacement of the traditional transudate/exudate concept was proposed. Ascitic fluid should be classified as high-albumin gradient or low-albumin gradient depending on the SAAG value (49,53,54). Both SAAG and ascitic fluid protein concentration are recommended for the initial evaluation of ascitic fluid in cirrhosis, proposed by the American Association for the Study of Liver Disease (AASLD) and British Society of Gastroenterology (47,55).
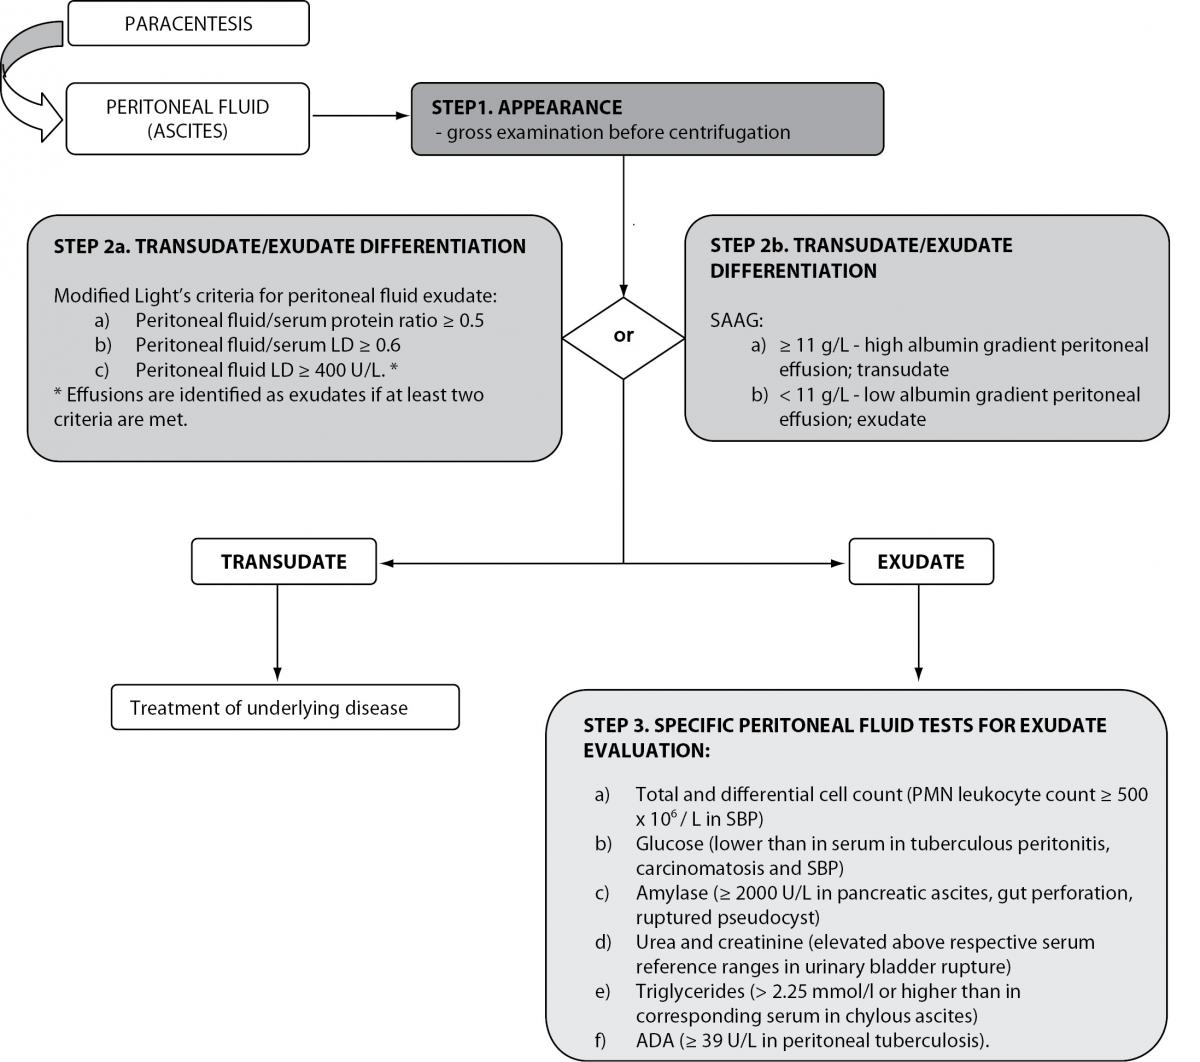
Figure 2. Biochemical analysis of peritoneal effusions.
LD – lactate dehydrogenase; SAAG – serum ascites albumin gradient; SBP – spontaneous bacterial peritonitis; ADA - adenosine deaminase.
Table 2. Modification of Light’s criteria for the differentiation of ascites.
It is important to note some methodological issues regarding albumin determination. In patients with cirrhosis, serum albumin concentrations below 11 g/L can be expected. In this case, depending on method assay range, incorrect results of SAAG calculation due to assay inaccuracy in the low range could occur, or the SAAG cannot be calculated at all. Chylous ascites can have falsely elevated albumin concentrations due to lipid fraction interference. Furthermore, since globulins contribute to the colloid osmotic pressure, but are inversely correlated to the SAAG, the presence of hyperglobulinemia (> 50 g/L) can have a pronounced impact on SAAG, falsely decreasing its values (6,45,56). It is still unclear if the time interval between serum and ascites sampling is of importance for SAAG calculation (57).
Specific analyses for ascites evaluation
After differentiation of ascites into two broad categories, specific biochemical analyses can be useful for further evaluation of ascites etiology (Figure 2).
All ascitic fluid samples should be screened for the development of spontaneous bacterial peritonitis (SBP). PMN leukocyte count in ascitic fluid ≥ 250 x 106 / L is the gold standard criterion for SBP diagnosis. Although not specific, it is a highly sensitive indicator of SBP. Ascitic PMN count of ≥ 500 x 106 / L is considered specific for the diagnosis of SBP (47,55,58,59). Because of poor prognosis, antibiotic treatment must be instituted immediately in all patients with suspected SBP, without waiting for microbiology test results (59). In order to reduce time for diagnosis, the usefulness of leukocyte esterase strip testing for diagnosing SBP in cirrhotic patients with ascites was investigated. Very high sensitivity and specificity of urine strip tests were reported compared against the gold standard. Additionally, it was suggested that the rapidity, low cost and wide availability of urine test strips could improve the management of patients with SBP, especially in cases of inflammatory cell clumping in ascitic fluid specimens (60-62). The determination of glucose in ascitic fluid is of little relevance in elucidating the etiology of ascites. Glucose concentrations found in ascitic fluid reflect those found in serum. However, low glucose has been reported in tuberculous peritonitis, carcinomatosis and SBP due to leukocyte or bacterial consumption. Decreased ascites protein concentrations are associated with high risk for developing SBP. AMY activity in ascitic fluid ≥ 2000 U/L is useful in identifying pancreatic ascites. Elevated ascitic AMY activity is also found in gut perforation with leakage into the peritoneum, ruptured pseudocysts and mesenteric thrombosis (6,45). The diagnostic utility of several tumor markers has been evaluated in diagnosing malignant ascites, especially in situations of inconclusive cytological findings. In general, they are considered of little clinical value compared to corresponding analyses in serum (63). Determinations of urea and creatinine concentrations in ascitic fluid can be useful to differentiate ascites from urine (45). Elevated concentrations of ascitic fluid urea and creatinine compared to simultaneously drawn serum, associated with elevated serum urea but normal serum creatinine, are indicative of the presence of urine (64). Chylous ascites is a rare but serious complication of abdominal surgery, abdominal malignancies, inflammatory diseases, abdominal infections or trauma. Chylous ascites can be differentiated from pseudochylous effusions by its high triglyceride concentration (higher than 2.25 mmol/L or higher than in corresponding serum) (45,65,66). However, since lymphatic fluid triglyceride concentration is associated with the patient’s nutritional status, the determination of triglyceride levels in serum and ascites simultaneously is necessary. Alternatively, ascites triglyceride concentration higher than 1.2 mmol/L are considered suggestive of chylous ascites (65). A systematic review, investigating the usefulness of ADA in ascitic fluid as a diagnostic tool in peritoneal tuberculosis, included 254 patients and revealed an optimal ADA cut off point at ≥ 39 U/L. An excellent diagnostic efficiency for the diagnosis of peritoneal tuberculosis was found with a sensitivity of 100% and specificity of 97% (67). In specific situations, the determination of other parameters in ascitic fluid may be clinically relevant: total bilirubin in cases of biliary leak, ALP in cases of intestinal obstruction or perforation, ammonia in cases of ruptured appendix, lactic acid in bacterial peritonitis, GGT in patients with alcoholic cirrhosis (6).
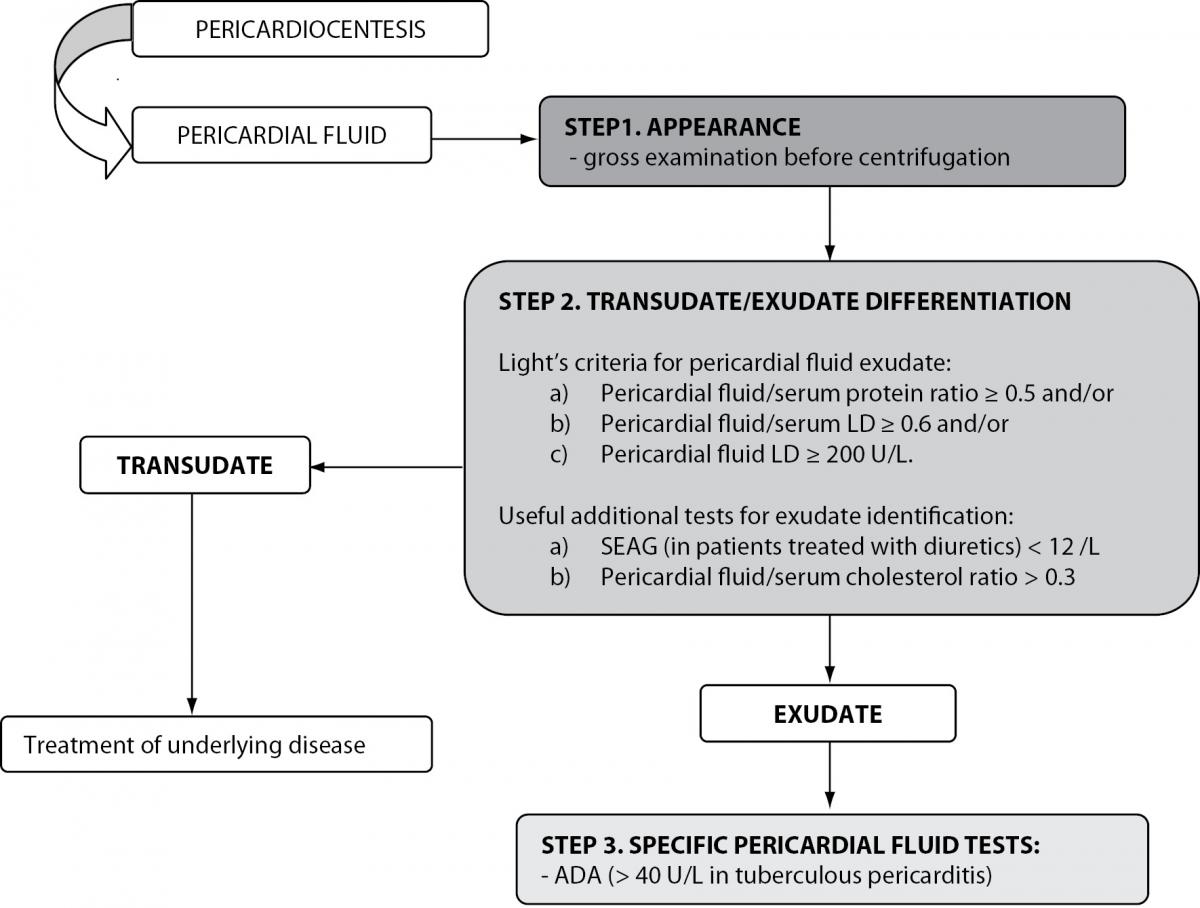
Figure 3. Biochemical analysis of pericardial effusions.
LD – lactate dehydrogenase; SEAG – serum effusion albumin gradient; ADA - adenosine deaminase.
Pericardial effusions
Pericardial effusions are characterized by accumulation of fluid in the pericardial space due to injury of the pericardium or pericarditis (6). Transudative pericardial effusions are usually associated with heart failure, hypoalbuminemia, post-radiation therapy and renal insufficiency, while exudative effusions result secondary to pericardial inflammatory, infectious, malignant or auto-immune processes (6,68). Echocardiography is used to diagnose the presence of pericardial effusions, but cannot be used to clearly determine their etiology. Pericardiocentesis, the removal of pericardial fluid, is used both for diagnostic and therapeutic purposes (6).
Appearance of pericardial fluid
Pericardial fluid is clear and pale yellow. Turbid fluid is indicative of infection or malignancy. Bloody fluid suggests malignant or tuberculous etiology. A milky appearance results from the presence of chylopericardium (6).
Differentiation of exudative from transudative pericardial effusions
Contrary to the well-established biochemical evaluation of pleural effusions, data concerning the diagnostic usefulness of biochemical tests for the evaluation of pericardial fluid are scarce. Meyers et al. evaluated the ability of various biochemical tests to correctly classify effusions as transudates or exudates in a retrospective study. The authors showed that exudative and transudative pericardial effusions can be differentiated using fluid total protein concentrations > 30 g/L, fluid/serum total protein ratio > 0.5 and fluid LD > 300 U/L. The highest diagnostic accuracy in identifying exudates was obtained using fluid/serum LD ratio > 0.6 (87%) (69). It must be emphasized that these results must be interpreted with caution because retrospective studies can potentially result in biased results and inaccurate conclusions. In a prospective study, Light’s criteria were applied to pericardial effusion differentiation and yielded a diagnostic efficiency of 94%, with a sensitivity and specificity in identifying exudates of 98% and 72%, respectively. Similarly to pleural effusion differentiation, the misclassification of transudative into exudative pericardial fluid was reported when Light’s criteria were applied to patients receiving diuretic therapy. The application of the SEAG concept, used in the evaluation of pleural effusions, yielded a sensitivity of 90% and specificity of 89% for the identification of pericardial exudates and was superior to Light’s criteria in patients on diuretics. Pericardial effusion cholesterol concentrations ≥ 1.2 mmol/L yielded a diagnostic efficiency of 83% in identifying pericardial exudates, with a sensitivity of 88% and specificity of 56%. When fluid/serum cholesterol ratio was calculated, improved diagnostic performances were obtained: a cut-off set at 0.3 yielded a diagnostic efficiency of 88%, sensitivity of 91% and specificity of 83% (6,70). However, Ben-Horin et al. investigated the composition of physiological pericardial fluid in a small cohort of patients selected for elective open-heart surgery. They found that pericardial fluid concentrations of small molecules (i.e. urea, uric acid, glucose and creatinine) were similar to those found in serum. In contrast, pericardial fluid LD concentration was 2.5-fold higher than serum LD, and total protein concentrations were 0.6 of their serum levels (71). The discriminatory accuracy of pericardial fluid/serum LD ratio, pericardial fluid LD and the pericardial fluid/serum total protein ratio was found to be unsatisfactory (72). Considering these findings, caution is needed when interpreting pericardial fluid LD and total protein according to Light’s criteria, because pericardial transudates may have levels of these parameters in the exudative range (70-73).
Evaluation of exudative pericardial effusions
The measurement of ADA in pericardial effusions has proven to be a rapid and accurate tool in identifying tuberculous pericarditis, especially in high prevalence areas. At a cut-off value set at 40 U/L, the diagnostic usefulness of ADA measurement in tuberculous pericarditis diagnosis yields 88% sensitivity and 83% specificity (74). CEA and neuron specific enolase have been investigated to identify malignant pericardial effusions. Although promising, the diagnostic utility of tumor markers is limited by the small number of patients investigated (6).
Preanalytical and analytical considerations
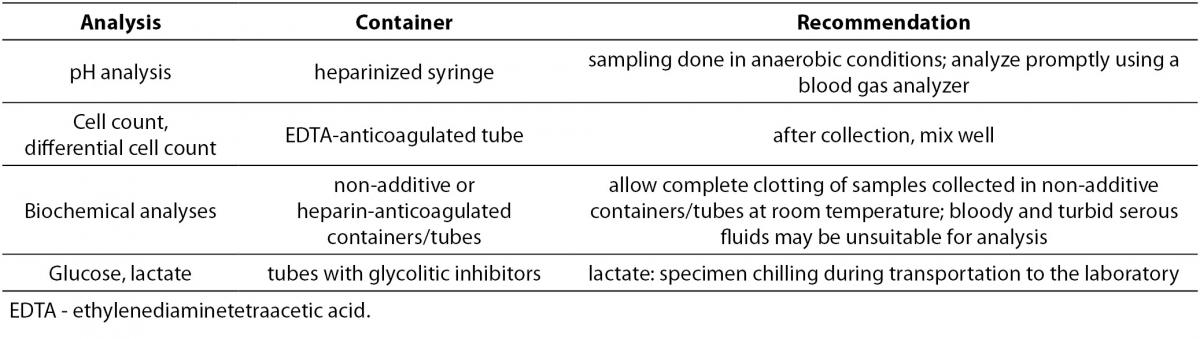
Since recommendations addressing the preanalytical phase for serous fluid testing are unavailable, serous fluid collection, handling and processing should be performed following the guidelines for serum or plasma specimens (64). After collection, serous fluid samples should be transferred into appropriate containers (Table 3) and immediately transported to the laboratory (75,76). Serum samples for the calculation of ratios and gradients should be collected within 30 minutes from serous fluid sampling (3).
Table 3. Containers used for serous fluid biochemical analysis.
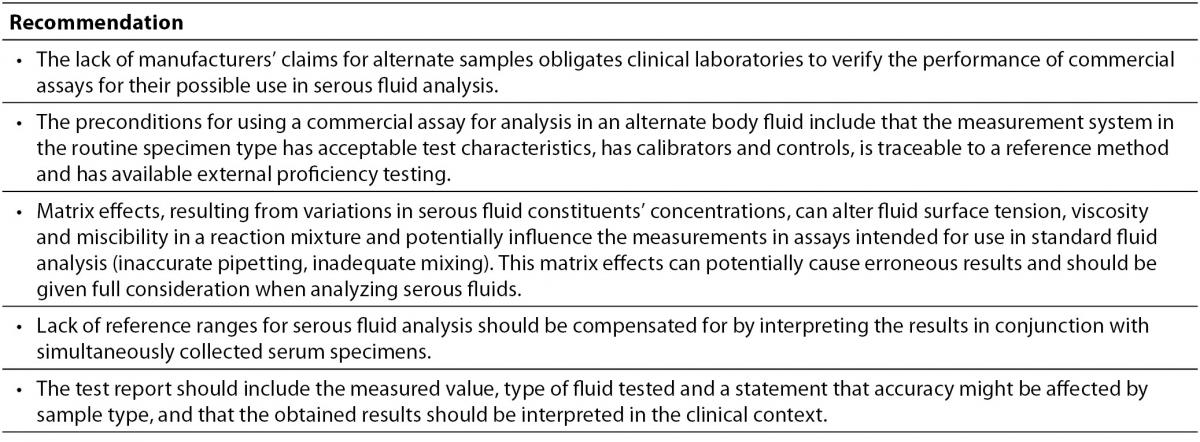
In recognition of the difficulties faced by clinical laboratories in serous fluid analysis the Clinical and Laboratory Standards Institute (CLSI) developed the document C49-A: Analysis of body fluids in clinical chemistry. A brief summary of the acceptable practice without the need for extensive method verification procedures is given in Table 4 (10,64,75).
Table 4. Recommendations for acceptable practice in serous fluids analysis (10,64,75).
Conclusions
When analyzing serous fluids, an approach addressing directly a specific clinical question, guided by the collaboration of specialists in laboratory medicine and clinicians, seems to be more appropriate and ultimately cost-effective than ordering a set of all available tests. Accordingly, diagnostic algorithms should be adopted to establish the biochemical analysis of serous fluids as an efficient tool helping the management of patients with serous effusions.