Introduction
The main laboratory error source is the preanalytical phase (1). Preanalytical errors still account for 60 to 70% of errors that occur in the laboratory, and most of them arise during sample collection (2). In spite of the laboratory automation, sample collection is still fundamentally manual. Frequent turnover of the nurses performing phlebotomies, shortage of skilled staff, and overloaded systems create preventable errors that might compromise patient safety, and increase health expenses (3,4).
The laboratory professionals should minimize the possible errors at any phase during the process, including sample collection. Besides, it is also necessary to monitor and control this crucial procedure in a daily basis to find out if any deviation occur and hence to establish different strategies to solve but also to prevent the weakness in this crucial procedure (5-7).
Many registers and indicators are generated during the entire laboratory process. Solutions, simplifications and modern management tools are necessary to monitor and control, to be able at a glance to evaluate the total testing process, in order to check the health of the organization at any moment. Balanced scorecard (BSC) is a management system (8) widely used in private organizations that can be applied to clinical laboratories (9,10). Initially, BSC was designed by adding to the traditional financial indicators, new indicators based on 3 additional perspectives: customer, internal business processes, and learning and growth of the organization members (11). By applying BSC, its use as a means to communicate strategy to the organization’s members emerged (12). Following further experience, BSC itself became a management system (not only a measurement system), a tool to achieve the organization vision. In fact, BSC translates the vision of the organization into a comprehensive set of quantifiable objectives and performance measures. It is a tool for implementing strategy with the help of metrics. Through strategies design, indicators targets and objectives are achieved in every one of the four BSC perspectives and hence in the long term, the organization vision is also achieved. BSC indicators are also classified in four perspectives. BSC designers recommended the number of indicators not to exceed 28 - otherwise they will cause attention distraction, diminish resource efforts, and weaken the strategic focus (11,12) - 7 for each perspective, which may not be easy to obtain in organizations with complex procedures such as a the clinical laboratory.
Nonetheless, utilization of numerous indicators in BSC makes it difficult to achieve a global interpretation. In many situations, the use of fewer but more comprehensive indicators is preferable. Thereon, some synthetic indicators have been defined that condense the measurement of several sub indicators into one value, thereby facilitating interpretation and better representing the process of healthcare delivery (13).
The hypothesis of the research was that continuous monitoring of preanalytical indicators and the use of synthetic indicator could easily help in the improvement and monitoring of the laboratory processes. The study sought to evaluate a monitoring system of preanalytical errors regarding not suitable samples for analysis, based on different indicators; to compare such indicators in different phlebotomy centres; and finally to evaluate a single synthetic preanalytical indicator that may be included in the BSC management system.
Materials and Methods
Setting
The laboratory is located at the public University Hospital of San Juan (Alicante, Spain), a 370-bed suburban community hospital that serves a population of 234,551 inhabitants, including 9 different primary care centres (PCC). It receives samples from inpatients, outpatients and primary care patients. Inpatients’ samples are collected in every ward by their nurses and transported to the laboratory and outpatients’ samples are drawn by the laboratory and other hospital departments’ nurses. In PCC, nurses obtain samples which are collected by two couriers following scheduled routes covering the different PCC and transported to the hospital laboratory sample reception desk.
Analysis
This was a retrospective cross-sectional study using records from January 2003 to December 2012.
A sample error was defined as a rejected specimen: any blood or urine sample that could not be successfully tested, as it did not meet the acceptability criteria of the laboratory, or a sample that was not received (14).
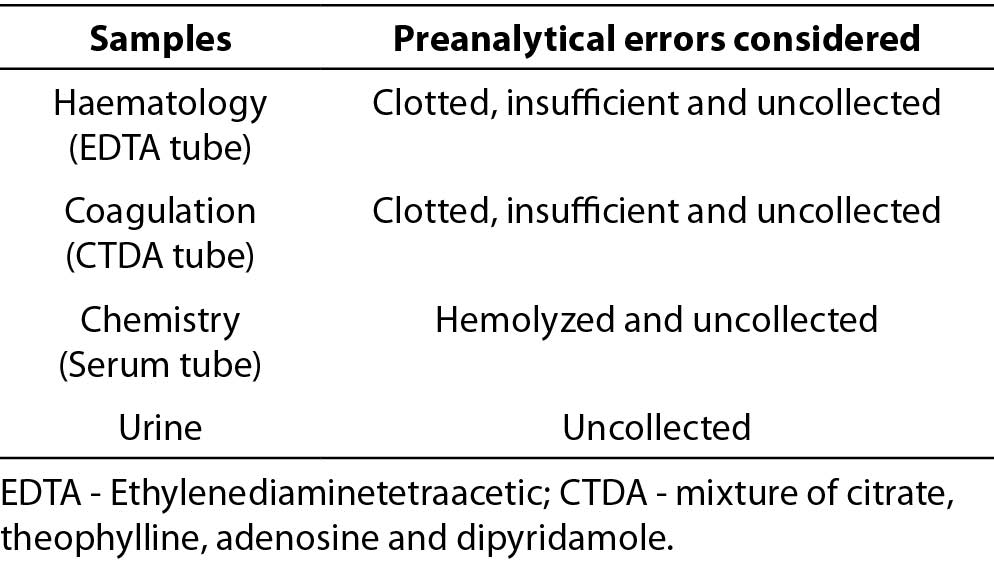
We collected preanalytical errors from the tests requested in haematology (Ethylenediaminetetraacetic acid (EDTA) tube), coagulation (mixture of citrate, theophylline, adenosine and dipyridamole (CTDA) tube), chemistry (serum tube), and urine samples. Specimens that were clotted, insufficient (for available technology), hemolysed (15), or uncollected (sample needed for processing requested tests, but not collected) were included. Only preanalytical errors that are frequent and easily affected by sample drawing procedure technical problems were chosen for monitoring, because those errors were recorded in the Laboratory Information System (LIS) since the beginning of the study. Table 1 shows preanalytical errors considered in each sample.
Table 1. Preanalytical errors considered in each sample.
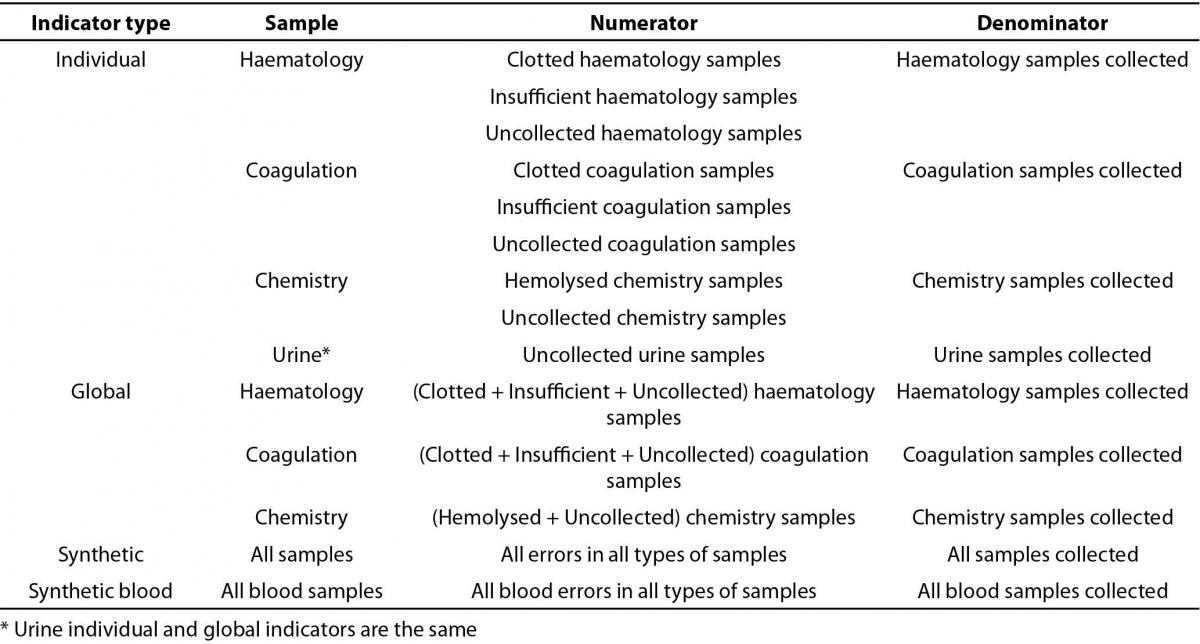
When a not suitable sample was identified, a specific coded result was registered in the LIS as the test result in order to report the incident and to request a new sample. Such coded results were used as the numerator of indicators that were designed and classified as individual and global. Individual indicators represented the type of preanalytical error with respect to every sample collected (three for haematology and coagulation, two for chemistry, and one for urine samples, as detailed in Table 2). Additionally, four global indicators, designed as the sum of all types of preanalytical errors with respect to every sample collected, were designed (urine individual and global indicators are the same). The synthetic indicator, which condenses the measurement of several sub indicators into one value (13,16), represents the sum of all types of preanalytical errors with respect to all samples collected. We also calculated an indicator for the total blood errors, built as the prior one, without taking into account urine samples. In all, 14 indicators were considered.
The indicators registers (coded results and samples) were collected and indicators calculated using a software program based on Data Warehouse and On-Line Analytical Processing (OLAP) cube (Omnium by Roche Diagnostics_ SUNSET Technologies, Gerona, Spain).
The number of errors per 10,000 samples was calculated. The number of errors per million samples was also calculated in the case of the synthetic indicator and then converted to a sigma level using a standard table that gives errors per million samples values corresponding to sigma levels (17). “Six sigma”, referred to the ability of processes to produce a very high proportion of outputs within specification, it comes from the concept that if there are six standard deviations between the process mean and the nearest specification limit, no items will fail to meet process specifications (18).
Table 2. Preanalytical indicators.
Statistical analysis
The measures were tabulated in Microsoft Excel 2007. The differences in indicator results of categorical responses between two independent groups were calculated by way of the comparison of proportions and Chi-square. A two-sided P ≤ 0.05 rule was utilized as the criterion for rejecting the null hypothesis of no difference.
Results
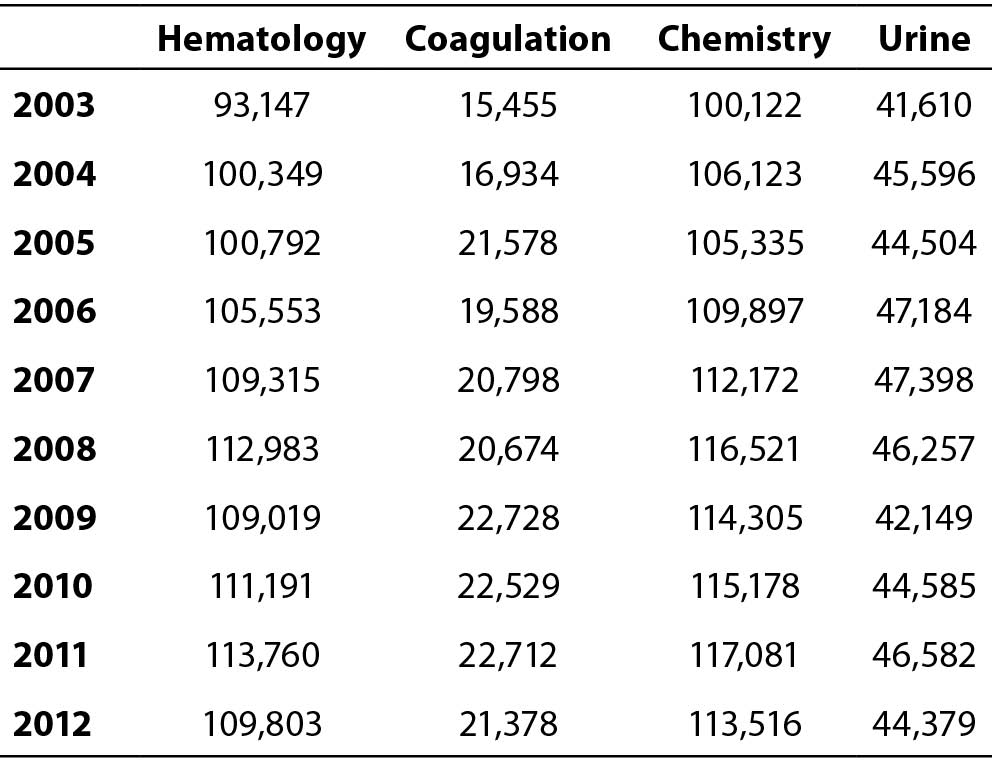
In the study period, 1,429,464 requests were received and 17,913,071 tests were performed; 101,534 requests and 2,230,476 tests for inpatients, 407,600 requests and 5,549,323 tests for outpatients, and 920,330 requests and 10,133,272 tests for primary care patients. The detailed number of haematology, coagulation, chemistry and urine samples received annually during the study period is shown in Table 3.
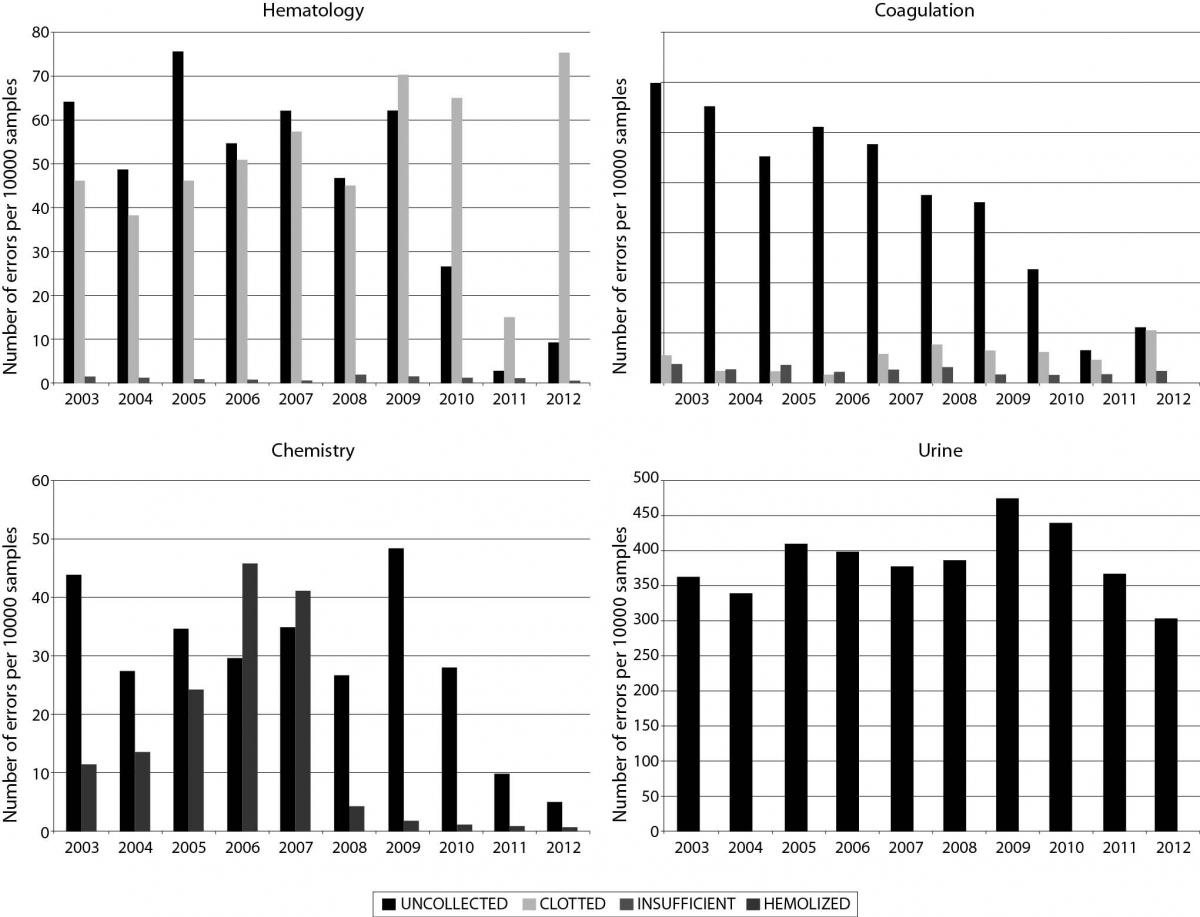
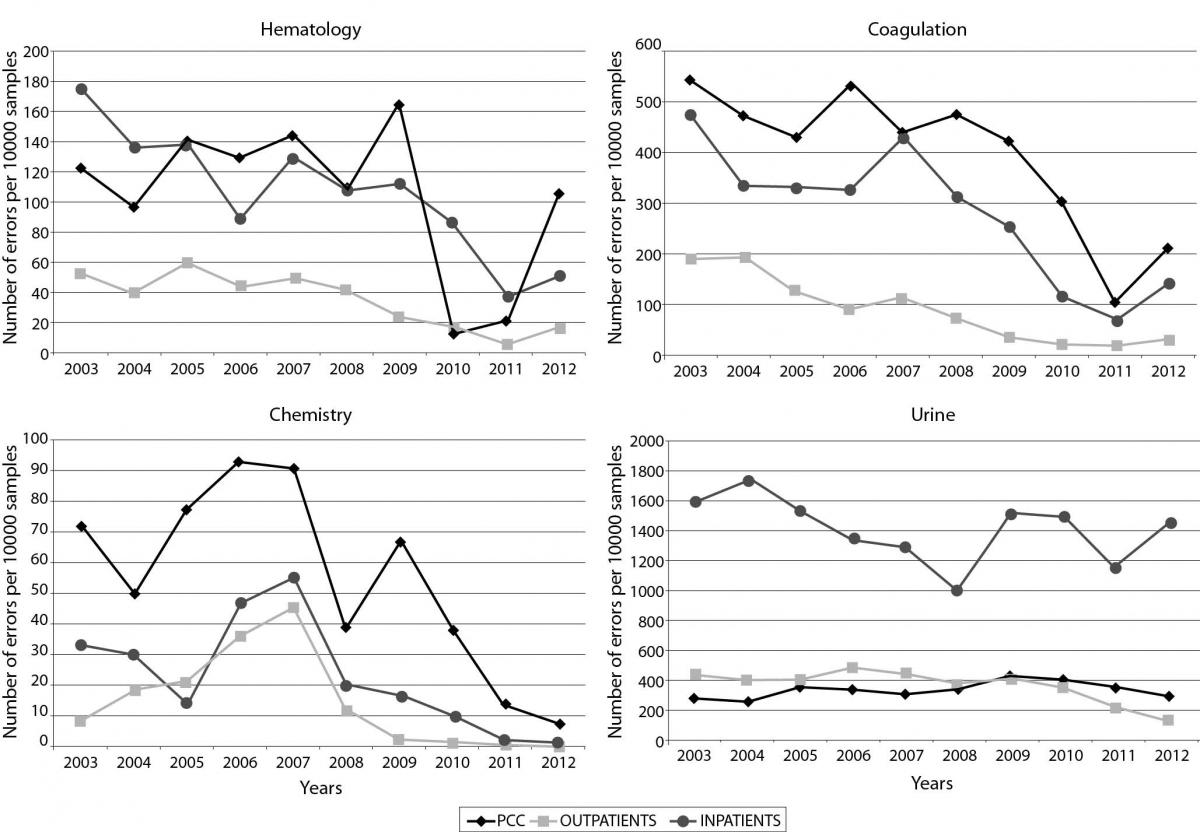
Daily, a set of indicators results (individual, global and synthetic) are obtained and integrated in laboratory quality system. The annual individual indicators results are shown in Figure 1. The four global indicators results - as errors per 10,000 samples - were significantly (P < 0.001) lower in year 2003 when compared to 2012 (haematology: 112.07 in year 2003 vs. 52.84 in 2012; coagulation 345.52 in year 2003 vs.120.12 in 2012; chemistry 55.53 in year 2003 vs. 5.46 in 2012; urine 361.45 in year 2003 vs. 302.62 in 2012).
The annual global indicator results for inpatients, outpatients and primary care patients are shown in Figure 2. The greatest number of errors in blood samples occurred in primary care patients. Total blood errors per 10,000 samples in year 2012 were significantly (P = 0.011) higher in primary care patients (55.84) than in inpatients (52.18) and outpatients (14.19). All annual global indicators results were higher in 2003 when compared to 2012 (P < 0.001).
Table 3. Number of haematology, coagulation, chemistry and urine samples received annually during the study period
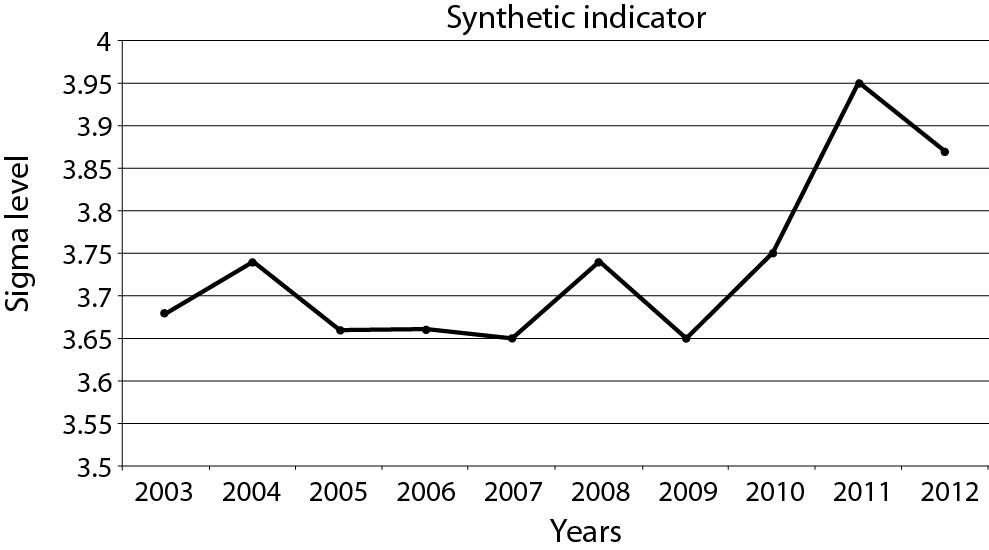
The annual synthetic indicator was again significantly (P < 0.001) lower in 2012 (90.14 errors per 10,000 samples) than in 2003 (144.92 errors per 10,000 samples). The synthetic indicator results, expressed as a sigma level (3.68 in 2003 vs. 3.87 in 2012), shows the same trend that prior indicator results, but in the opposite direction: the higher the sigma level, the higher the performance of the process, and the lower number of errors and variability (Figure 3).
Discussion
The study evaluates a ten year monitoring of preanalytical errors regarding not suitable samples through quality indicators. There was a decrease in the number of errors along the years. The highest number of errors occurred in primary care patients, and the best results were seen in outpatients. We present a synthetic indicator, whose results reflect trends in the prior specific indicators results, as a summary of preanalytical quality. It could be included in the BSC management system to find out, through the use of a single indicator, if the objective of improvement of the preanalytical phase is achieved along the years.
As illustrated by prior investigations (6,7) the first key to indicators results reliability, is the use of the daily laboratory registers to identify the errors. We used the specific codified results, which were indispensable in providing unsuitable test specimen results, as a quality record. The automated and continuous collection of the LIS quality records (specific codified results & samples) and indicators calculation by means of the software application based on data warehouse and OLAP cubes is the second key to results reliability in the study. The use of this technology means that at no time were the numbers of errors recorded, collected, or calculated manually. Indeed, the reliability of this type of indicators makes them very useful to compare preanalytical errors between different laboratories (19).
Figure 1. Annual individual indicators results: Shows each type of preanalytical error with respect to every sample collected (three in haematology and coagulation, two in chemistry, and one in urine samples).
The trend in sample errors during ten years of monitoring reflects the corrective actions carried out in order to correct and improve the status, referred through global indicators of sample errors measurement. The actions carried out in order to correct and improve the status were educational programs for nurses, technological interventions to automate manual steps in phlebotomy procedure and promotion of the communication between the laboratory and peripheral phlebotomy centres (6,7). In fact, the synthetic and global indicators provide general information, just a trend in the preanalytical errors during the monitoring of preanalytical performance. When deviated, in order to implement specific interventions aiming to reduce sample errors, each specific indicator should be considered.
Figure 2. Annual global indicator results in every type of patient: Shows the sum of all types of preanalytical errors with respect to every sample collected in inpatients, outpatients and primary care patient’s samples.
The observed preanalytical errors in our study were similar to that previously published (6,20,21). In an attempt to compare our results with those from the IFCC working group, we observed that we had more errors in hemolysed chemistry samples and fewer errors in clotted haematology samples (22). As in the other studies (23), uncollected samples were the most frequent problem encountered. Altogether, there was a decrease in the number of errors along the ten years. This pattern was confirmed in any setting. Less rate of errors occurred in outpatients, followed by inpatients and primary care patients. In fact, outpatient’s samples showed lower preanalytical errors than the primary care patients, despite dealing with more seriously ill patients and more complex examinations. In primary care patients, more errors were observed than in the majority of the studies (20), which substantiates the influence of the blood drawing personnel (24). Besides the personnel performing the phlebotomy, it is important to consider transport (25,26) and storage conditions as an additional source of preanalytical errors. Careful handling of the specimen during transport and processing is imperative in maintaining the quality of a meticulously collected specimen. The importance of transport in exposure to heat and cold, vibration, position of specimen tubes and overall time to delivery can significantly affect test results. The rate of errors generated in inpatients whose samples are collected by hospital ward nurses, were at an intermediate level between those observed in PCC and laboratory. The proximity between hospital and laboratory nurses should generate an easy and fluid daily communication that should result in the best results as compared to PCC nurses. This fact confirms the strong dependency of preanalytical sample errors on the blood drawing personnel: best results are obtained when performed by the laboratory personnel (24). To our knowledge this is the first study referring that better preanalytical results are showed the closer is the blood drawing staff to the laboratory. A critical prerequisite for suitable specimens is dependent upon the degree of laboratory supervision of this procedure (3). The training, ability, and implication of the professionals are fundamental.
Figure 3. Annual synthetic indicator results: Shows the annual synthetic indicator results that represent the sum of all types of preanalytical errors with respect to all samples collected calculated as the number of errors per million samples and converted to a sigma level.
Our study of ten years of preanalytical indicators results presents an additional indicator that tries to summarize in a single measurement the incidences occurred in all samples. Comparing the results reported in Figures 2 and 3, it seems evident that the synthetic indicator reduces significantly the amount of information. However, in order to implement specific interventions aiming to reduce sample errors, each specific indicator should be considered. The global indicator, instead, may provide general information only, just a trend in the preanalytical errors during the monitoring of staff performance. Thus, the usefulness of BSC synthetic indicator is as a first step for the efficiency of the quality system in the identification and resolution of errors. In view of the synthetic indicator results, both ways of measurement, through the use of defects per million opportunities or six-sigma are appropriate, but the latter may be simpler and easier to understand. The testing process is complex, consists of numerous steps. As it is commonly known, a six-sigma process is one in which 99.99966% of the outputs are free of defects, compared to a one-sigma process in which only 31% are free of defects. The obtained result around a sigma level of 4 in just a phase of the total testing process, which indicates that the process involved is controlled (27). However, once again alerts us that we must encourage the improvement in the quality of laboratory and hence patient safety. This index shows an accurate summary of the individual and global indicators results. Its utility in BSC management system seems clear; with one indicator, contained in the BSC Internal procedure perspective, it may be possible to monitor preanalytical outcome over time in a macro level. However, the synthetic indicator does not reflect all preanalytical errors and its sensitivity is less than individual indicators.
One limitation is that the study includes some important preanalytical quality indicators concerning not suitable samples; however, other preanalytical errors with respect to missing or incomplete/wrong patient identification (28), improper transport, handling or sample labelling (wrong tube, tube broken, contamination of the sample, etc.) were not included (22).
Conclusion
We have presented a practical and effective method to monitor unsuitable sample preanalytical errors. Fewer errors occurred in outpatients, followed by inpatients and primary care patients, suggesting that the farther the phlebotomy personnel from the laboratory, the more frequent the errors. Finally the synthetic indicator summarizes overall preanalytical sample errors, and can be used as part of the BSC management system. The implementation of a systematic and continuous preanalytical monitoring over time may promote a continuous improvement, which will benefit patient outcome and safety (2).
Acknowledgements
The authors wish to thank all the laboratory staff, for its excellent delivery of laboratory services and special thanks to English teacher, Caroline Dale.