Introduction
There is firm evidence that results of laboratory tests provide a substantial contribution to clinical practice. While laboratory errors are traditionally identified with analytical problems, an extensive scientific literature now attests that most errors (up to 80-90%) seem to occur from the extra-analytical phase.
According to the most representative studies, preanalytical errors represent more than half of the total errors which occur in the clinical laboratory (1,2) and within this type of errors, for its importance, it is remarkable the quality of the samples to analyze (3,4). Thus, the hemolysis, hyperbilirrubinemia and turbidity of serum can greatly affect the accuracy of many laboratory tests (5).
The establishment of the concentration of lipids which produce significant interference depends on the analyzer, reagents, analytical method and the concentration of interfering constituents that we are measuring (6).
Lipemic sera are often found in the practice of clinical laboratories and can cause significant interferences in the analytical results of different biochemical parameters (7,8). The most common causes of the occurrence of lipemia are diet, alcohol ingestion, diabetes mellitus (9), hypertryglyceridemia, chronic renal failure, hypothyroidism, pancreatitis, multiple myeloma, primary biliary cirrhosis, lupus erythematosus, total parenteral nutrition (10), drugs such as protease inhibitors (HIV infection), estrogen, oral contraceptives, etc.
Lipemia may interfere with tests which use transmission of light as part of their measurement system. The interference caused by lipemia is due mainly to three distinct mechanisms: light scattering, increasing non-aqueous phase and effects of partition between polar and non polar phases (7).
Regarding routine clinical chemistry analyzers, the partitioning effect is the least frequent problem of the three potential mechanisms for interference.
The increase in non-aqueous phase will affect all methods that do not measure the activity of the analyte and leads to volume displacement errors, by reducing the water available in the volume of the sample. This is important because more analytes are dissolved in the aqueous phase of serum/plasma.
Lipemia interference is also due to increased light scatter and the absorption of the light by the lipids (mainly chylomicrons and very low density lipoproteins) in the spectrophotometric methods. This phenomenon causes a decrease in the intensity of light reaching the solution, which will be absorbed (11), so the turbidity most likely affects the photometric methods than the non-photometric methods. Both chylomicrons and VLDL particles produce this phenomenon, but in both cases the particles are very heterogeneous and there is an enormous variation in their size and triglyceride content, so the direct measurement of triglyceride content does not show good correlation with the phenomenon of light scattering. Moreover, the turbidity of the samples was very weakly correlated with the concentration of triglycerides present in the sample (12,13). Due to the heterogeneous nature of lipemia there are difficulties in the simulation in the laboratory of lipemic samples, and presently there are no standardized materials that simulate lipemia adequately. Glick and collaborators (6) used already a synthetic emulsion for intravenous administration that is known to simulate lipemic samples and is called Intralipid, but Bornhorst et al. (14) in a subsequent investigation made it clear that we must be very cautious in interpreting results interference studies in which Intralipid was used to simulate lipemia, since these solutions can not accurately mimic lipemia. This is so because both VLDL and chylomicrons represent a heterogeneous group of particles that vary greatly in size and number, between individuals and also as to their content of triglycerides (15). The differences in the size of the particles in lipemic samples can greatly affect the effect of light scattering and the turbidity (15,16). Neither a single concentration may provide enough results so it is advisable to use a wide range of hyperlipidemic samples.
In the present study, sera with a high content of triglycerides (visibly turbid), but in different concentrations were used and these samples were subjected to an ultracentrifugation process to clarify the samples. Ultracentrifugation separates lipid complexes, preferentially larger, less dense (chylomicron) and VLDL particles, being both located on the top and we have determined the concentration of the different routine biochemistry parameters in the samples before ultracentrifugation and in the infranadant obtained after ultracentrifugation.
Materials and methods
Samples
This study was performed in the Biochemistry laboratory of the Hospital General Yagüe of Burgos (Spain), from January to June of 2009. This is a tertiary hospital that receive on routine analysis about 500-600 samples daily of which 3-4 samples are visibly turbid (0.6-0.7%).
Among all of these routine samples, we selected the samples which were visibly turbid and after their centrifugation (1.500 x g for 15 minutes) three aliquots were obtained, one of which was used to determine appropriate parameters, another was further subjected to the ultracentrifugation process, after which the same biochemical determinations from the previous case were repeated. The third aliquot was frozen at -80 °C for possible checks. A total of 110 samples were studied, although in some of them there was not enough amount of sample to perform the biochemical analysis of all the
different parameters. The process by which samples were subjected involved ultracentrifugation at 40.000 x g and +4 °C, without adjustment of density (d = 1.006 kg/L) for 18 hours in a Centrikon T-1080 Ultracentrifuge (Kontron AG, Switzerland). Ultracentrifugation can achieve greater speed of rotation than high speed centrifugation, and therefore generate higher centrifugal forces.
different parameters. The process by which samples were subjected involved ultracentrifugation at 40.000 x g and +4 °C, without adjustment of density (d = 1.006 kg/L) for 18 hours in a Centrikon T-1080 Ultracentrifuge (Kontron AG, Switzerland). Ultracentrifugation can achieve greater speed of rotation than high speed centrifugation, and therefore generate higher centrifugal forces.
Methods
The supernatant was carefully separated and biochemical determinations were made in the infranatant. The analytical parameters determined (in the first aliquot and in the aliquot subjected to ultracentrifugation) were the following: cholesterol, triglycerides, alkaline phosphatase (ALP), gamma-glutamyl transferase (GGT), aspartate aminotransferase (AST), alanine aminotransferase (ALT), lactate dehydrogenase (LD), total bilirubin, total calcium, creatinine, phosphorus, glucose, iron, urea, uric acid and total protein in a Hitachi Modular D and P (Roche Diagnostics, Mannheim, Germany).
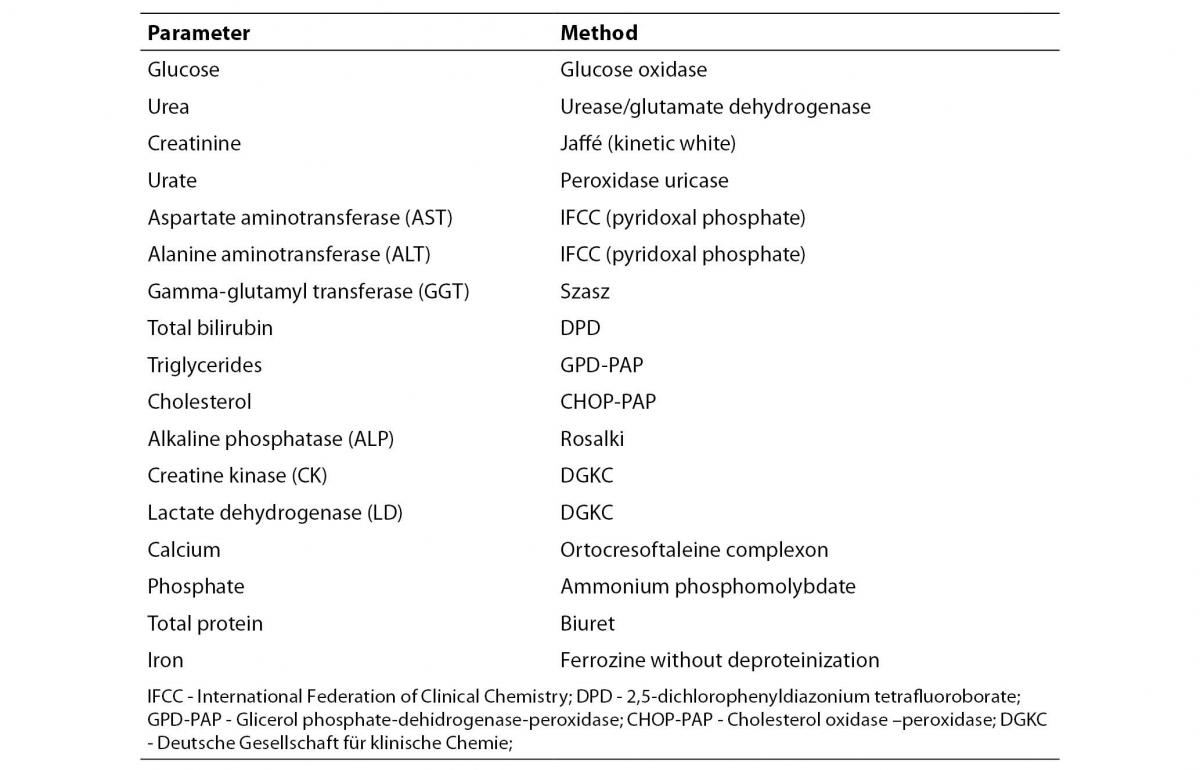
Analytical methods employed for each of the biochemical parameters that have been determined are presented in table 1. The maximum number of samples analyzed was 110 for Uric acid, Urea and Total Protein and the minimum number was 93 for Iron.
Table 1. Analytical methods used in the D, P Modular Analyzer (Roche Diagnostics, Mannheim, Germany)
Statistical analysis
Normality was tested for each variable. Variables that were distributed normally were presented with arithmetic mean ± standard deviation. Variable (triglycerides) that was not distributed normally was presented with median and interquartile range.
To compare the average values of the various parameters measured before and after being subjected to ultracentrifugation parametric Student t test for paired data (for normally distributed data) and nonparametric Wilcoxon test (for triglycerides) were used.
Percentage of change was calculated for each analyte before and after centrifugation and compared to desirable inaccuracy according to data published in the literature (17).
Statistical analysis was performed using SPSS software (SPSS Inc., Chicago, Illinois, USA).
Results
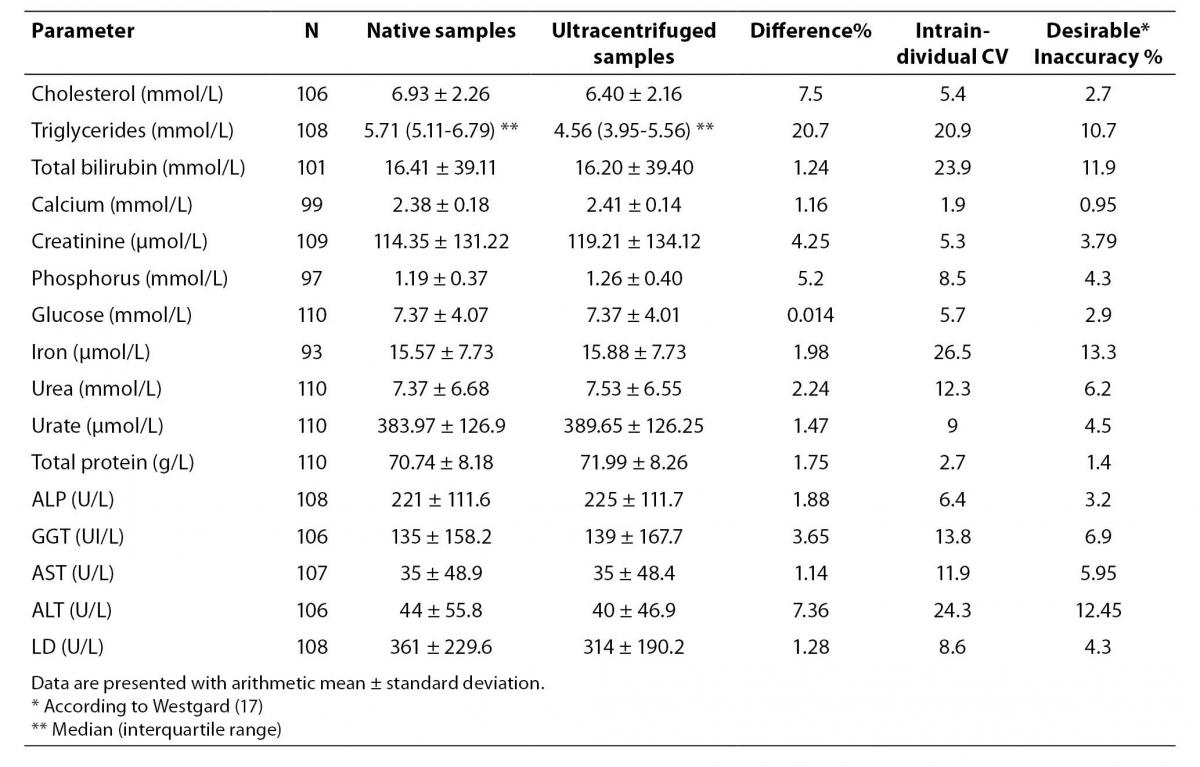
The results of the various serum parameters measured by spectrophotometric methods before and after samples were subjected to ultracentrifugation are presented in Table 2.
In this table the mean concentration before and after ultracentrifugation and the number of specimens analyzed is expressed as well as the median, the standard deviation or Q1-Q3 for each parameter, the percentage change in the mean values after samples being subjected to ultracentrifugation, the intraindividual variation coefficient and the desirable inaccuracy for each of the parameters, according to data published in the literature (17).
Aside from the expected changes in the concentration of triglycerides (20.67%) and cholesterol (7.50 %), the greatest difference in the parameters analyzed was found for ALT (7.36%). Minor changes were found in the concentration of phosphorus (5.20%), creatinine (4.25%), GGT (3.04%), urea (2.24%), iron (1.98%), ALP (1.88%), total protein (1.75%), uric acid (1.47%), total bilirubin (1.24%), calcium (1.16%) and AST (1.14%). Glucose with less than 1% difference was the least affected parameter.
When the values of various parameters measured before and after ultracentrifugation were compared, significant differences were observed in all cases except for total bilirubin (P = 0.881), GGT (P = 0.326), glucose (P = 0.972) and AST (P = 0.609).
In the rest of the parameters we obtained significant differences with a significance level of P <0.001 except for calcium which had a significance level of P < 0.005 and urea with P < 0.05.
Discussion
In this study we have found significant differences before and after ultracentrifugation in lipemic sera in all parameters studied except for total bilirubin, GGT, glucose and AST.
Studies by Brady et al. and Jabbar et al. show that the majority of analytes are affected by hyperlipidemia (18,19). In this sense, The Committee for the Implementation of the French Society of Clinical Biology (SFBC) (20) decided to study the interference problems caused by “visible” interferences - bilirubin, hemolysis and turbidity, and their effect in 20 biochemical tests (13 of which were substrates and 7 enzymes). These parameters were measured in the 15 Autoanalyzers more representatives of those found on the French market. To cause turbidity in the serum, Intralipid was added. The different tests were not affected with equal intensity. Substances with higher interference by turbidity were, in this order, uric acid, iron, total protein and bilirubin.
Also, Steen et al. (21) conducted a multicenter analysis of 16 Dutch clinical laboratories, evaluating the interference caused by hemolysis, hyperbilirubinemia and lipemia in the determination of 32 different analytes. On the basis of biological variation these authors suggested a cut-off value above which, clinically significant interference exists. They found clinically significant interference from lipemia in 12 of the 32 analytes studied. The experiment was carried out also with test samples from a pool spiked with 10% Intralipid.
An important concept to consider when we refer to interference in biochemical analysis is that we must differentiate between “analytically significant interferences” and “clinically significant interferences”. The first are those that according to the IUPAC (International Union of Pure and Applied Chemistry) produce in an analytical procedure a systematic error greater than three times the standard deviation found in a study of precision for a given concentration of the component under study (22) and produce a systematic error greater than the one justified by the imprecision or the uncertainty of the method.
The “clinically significant interferences” are those that generally lead to significant errors in the interpretation of laboratory results. These interferences should be considered as such when, in relative terms, the value of the interference is greater than half the intraindividual biological coefficient of variation (17,23).
According to Glick the differences between the samples with or without interference must be below 3%, when assessing the result of a sample for a short term follows up, and to monitoring a patient for a long-time this author can accept a maximum range equal to the objective of inaccuracy of the method, except for ALT, CK and GGT in which the change should not exceed 10%. When the result is to be used in the screening of population it is consistent to choose the total error as the limit of permissiveness, except for GGT and triglycerides in which is preferable to choose higher standards.
In the study under consideration the differences between the two measurements, native and ultracentrifugated samples did not exceed 10% and the total maximum error allowed has not been exceeded in any of the techniques.
We found clinically significant interferences according to biological coefficient of variation and objectives of inaccuracy (17) for the following parameters: phosphorus, creatinine, total protein and calcium (Table 2).
Table 2. Variation in the concentration of the different parameters measured by spectrophotometry before and after samples were subjected to ultracentrifugation
Methods for removal lipids of the samples include ultracentrifugation (the gold standard), high speed centrifugation and lipid clearing agents, mainly Lipoclear. Vermeer et al. (24) compared reducing lipemia by high speed centrifugation or treating sera with Lipoclear and irrespective of the methodology used found excellent recovery in most of cases, but using high speed centrifugation the recovery was unacceptable for total bilirubin and CRP and using Lipoclear the recovery was inacceptable for GGT, HDL cholesterol, cholesterol and CRP.
On the other hand, Anderson et al. (25) using a clarifying agent Lipoclear, found no critical differences in the concentration of the analytes studied before and after treatment with Lipoclear, except in the concentration of total protein, phosphorus and an expected fall for cholesterol and triglycerides.
Moreover, there are too few studies using native lipemic samples, but Dimeski et al. (26) in a recent study evaluated a procedure with 10 native sample pools for the capacity to reduce lipid concentration using a speed micro centrifuge compared with an ultracentrifuge. It appears that the high speed centrifugation procedure used by Dimeski et al. (26) is superior to the one utilized by Vermeer et al. (24), perhaps by the higher centrifugation speed and the double centrifugation process used by Dimeski. Data obtained by Dimeski et al. (26) confirm that when several re-centrifugation steps are performed, high speed centrifugation is almost as effective as ultracentrifugation in lipid reduction.
The main limitation of our study is that we have used ultracentrifugation to reduce lipemia and many laboratories do not have ultracentrifuges, moreover this is a very long procedure for treatment of samples that come, in many occasions, from Emergency Services.
Further studies are needed that compare ultracentrifugation methods with high speed centrifugation methods and the use of Lipoclear. It is necessary to correlate these methods with serum indices obtained in the autoanalyzers (based on alternative photometric wavelength measurements). This is so because most laboratories rely on the lipemic index and manufacturer method recommendations for acceptable limits that are almost always established by using emulsions spiked samples, and emulsions do not behave in the same way as native lipemic samples.
Conclusion
Although the percentage change in the concentration of different analytes before and after ultracentrifugation in hyperlipidemic sera never exceeded the total allowable error, significant differences in all parameters were found except for total bilirubin, glucose, GGT and AST and a variation that exceeds the allowed desirable inaccuracy and therefore clinically significant interferences in phosphorus, creatinine, total protein and calcium.
This gives an idea of the importance of proper treatment of lipemic samples and the significance of interferences in preanalytical phase and in the whole process of biochemical analysis of serum samples.