Introduction
Several lines of evidences attest that the pre analytical phase is responsible for more than two thirds of all errors arising from the total testing process (1-4). There are only few routine procedures for the detection of non-conformities in this field of activity (5,6). In this phase the procedures involving phlebotomy, critical to the obtainment of diagnostic blood specimens, are poorly studied as regards the major sources of errors and the procedures related to quality control process (7,8). Despite significant improvements in blood sampling equipments and procedures during the last two decades (e.g. positive patient identification, vacuum tubes for blood sampling, improved needles for phlebotomy and operator safety, among others), it is still important to emphasize that procedures of phlebotomy need attention and a more careful and systematic supervision in order to prevent errors (9). The collection of diagnostic blood specimens for clinical biochemistry tests is traditionally performed by phlebotomists using a tourniquet for evidencing veins (10). The Clinical and Laboratory Standards Institute (CLSI), formerly known as National Committee for Clinical Laboratory Standards (NCCLS), recommends the use of the tourniquet for localizing suitable veins and the tourniquet time can not in any case be extended over 60 seconds. When performing specimen collection for diagnostic purposes such an interval of time is considered suitable for both easing localization of vein paths and concomitantly circumventing possible problems due to venous stasis (11,12). As such, although the venous stasis can influence the concentration and/or the activity of several blood analytes, the tourniquet time is rarely regarded as a potential source of laboratory variability (13-17).Standard proceduresnotwithstanding, the mean tourniquet application time by phlebotomist reportedly was 98 sec in public laboratories and 70 sec in private laboratories respectively, thus arising some issues about proper specimen collection (18). The use of transillumination devices (TD), based on cold near infrared light-emitting diodes (LEDs) whose light is absorbed by intra-erythrocyte haemoglobin flowing along the veins, has been formerly proposed in order to ease the vein puncture in children (19). The efficacy of palm transillumination for establishing venous access in small infants has already been assessed (20). Moreover, the transillumination has been proposed for mapping veins to be cannulated prior to ambulatory phlebotomy, because it would allow a more accurate visualization of the vein course (21). With the aim to improve the quality management in preanalytical phase of the clinical biochemistry laboratory, we evaluated whether TD could advantageously replace the tourniquet during the procedure for collection of diagnostic blood specimens and thereby completely eliminate the risk of bias in laboratory testing due to venous stasis.
Materials and methods
Study design
250 outpatient adults of both genders, volunteers for this study, from Dante Pazzanese Cardiology Institute, São Paulo city, Brazil, were evaluated. This study was submitted to the Internal Review Board and approved by the local Human Research Ethics Committee. All volunteers signed an informed consent.
Collection of diagnostic blood specimens
The collection of diagnostic blood specimens was accomplished by a single, expert phlebotomist, following the international standard from CLSI (11,12). First, we studied 50 patients (G1). All patients, after 12-hours fasting, were maintained seated during 15 minutes to eliminate possible interferences of blood distribution due to different posture (22). After this interval, a vein was located on the left forearm by a subcutaneous tissue TD (Venoscópio IV, Duan do Brasil, Brazil), and the diagnostic blood sample was collected using a 20 G straight needle (BD Vacuntainer®, Becton Dickinson Diagnostics, Franklin Lakes, NJ, USA), directly into 5 mL SST II Advance® vacuum tubes with clot activator and acrylic gel separator, (BD Vacuntainer®, Becton Dickinson Diagnostics, Franklin Lakes, NJ, USA). All the tubes used in this study were of the same lot. In sequence, a tourniquet was applied on the right forearm during 30 sec (11,12), and another sample was collected into the same type of vacuum tube. The time interval between TD and tourniquet blood drawing was standardized to 60 ± 10 sec. The study was then continued by evaluating the other 4 groups (G2, G3, G4 and G5) of 50 different volunteers each, and the same methodology for diagnostic blood sample collection was applied, but the tourniquet time varied as follows: in G2 the tourniquet was applied for 60 sec (accepted standard time for tourniquet applied) (11,12), in G3 for 90 sec, in G4 for 120 sec and in G5 for 180 sec.
Processing of diagnostic blood specimens
All the sample tubes were left in upright position for 45 min at room temperature (20 °C) to allow complete blood clotting before centrifugation (11). After centrifugation at 1500 x g for 10 min at room temperature (according to the instructions of the manufacturer), serum was separated, stored in aliquots and kept frozen at -70 °C until measurement. All samples did not show any sign of haemolysis by visual inspection. No specimen was discarded due to unsatisfactory attempts, difficulty in locating venous access, missing veins, manifest haemolysis or lipaemia.
Laboratory testing
All serum aliquots were thawed in same time. The routine clinical biochemistry tests were performed in duplicate immediately after thawing on the same instrument VITROS 5,1 FS Chemistry System (Ortho-Clinical Diagnostics), according to the manufacturer’s specifications and using proprietary reagents. The panel of tests included the following: glucose (GLU), total protein (TP), albumin (ALB), triglycerides (TRIG), potassium (K), sodium (NA), phosphate (PHOS), calcium (CA), alkaline phosphatase (ALKP) and magnesium (MG). The instrument was calibrated against appropriate proprietary reference standard material and verified with the use of proprietary quality controls. A multicenter evaluation of the within-run precision of the VITROS® 5,1 FS Chemistry System showed coefficients of variation ranging from 1.2% to 1.5% for GLU, from 1.2% to 2.0% for TP, from 0.9% to 1.7% for ALB, from 0.9% to 1.4% for TRIG, from 1.21% to 1.25% for K, from 0.61% to 0.65% for NA, from 1.5% to 2.4% for PHOS, from 1.4% to 1.6% for CA, from 2.1% to 2.4% for ALKP, from 1.5% to 2.9% for MG (23).
Statistical analysis
The significance of the differences between samples, taking the values from samples collected using the subcutaneous tissue transilluminator device as the reference ones, was assessed by paired Student’s t-test after checking for normality using licensed statistical software (GraphPad Prism® version 5.01). The level of statistical significance was set at P < 0.05. Finally, the biases from G1, G2, G3, G4 and G5 were compared with the current desirable quality specifications for bias (B), derived from biological variation according to the formula B < 0.25 (CVw2 + CVg2)1/2 where CVw and CVg are within- and between-subject coefficients of variations (24).
Results
The results of the study are shown in Table 1.
Table 1. Concentration of tested biochemical parameters in subgroups according to different type of phlebotomy (transillumination device vs. tourniquet)
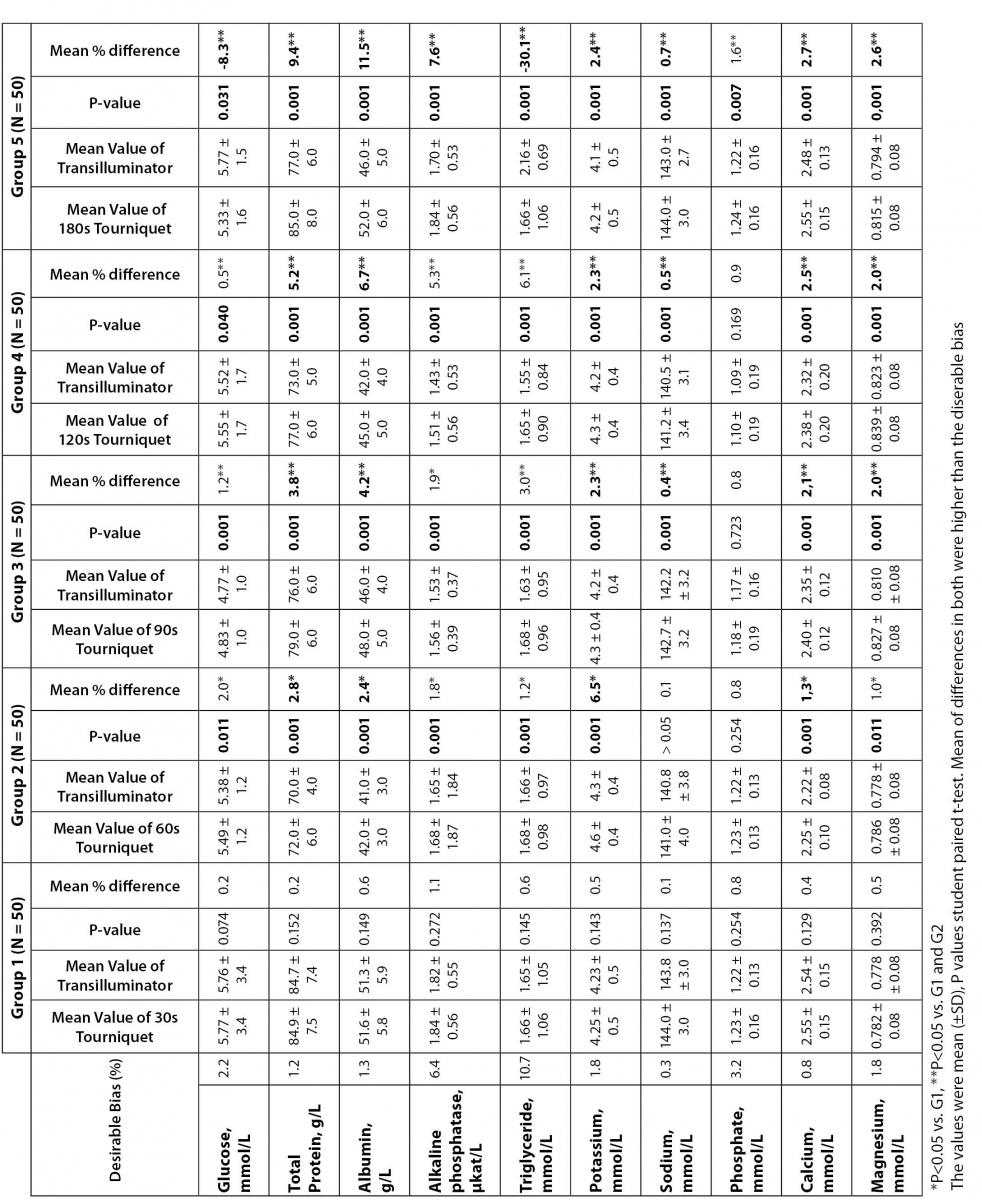
Compared with TD, in G1 no significant increases were observed for clinical chemistry tests evaluated after 30 sec of the tourniquet application. In G2 (i.e., after 60 sec of tourniquet), significant increases were observed for GLU, TP, ALB, TRIG, K, CA, MG and ALKP. In G3 and G4, significant increases were observed for all the parameters tested except PHOS. Finally, in G5 (after 180 sec tourniquet application) significant increases were observed in all the clinical chemistry tests evaluated. Clinically significant variations, as compared with the current desirable quality specifications (24), were however observed for TP, ALB, K and CA after 60, 90, 120 and 180 sec of stasis (Group 2, 3, 4 and 5); for NA after 90, 120 and 180 sec of stasis (Group 3, 4 and 5); for MG after 90 and 180 sec of stasis (Group 4 and 5); for GLU, TRIG and ALKP only after 180 sec of stasis (Group 5).
Discussion
A superficial knowledge of the importance of details such as a) adequate fasting time before blood collection (25); b) use of appropriate tubes (26-28) and additives (29); c) factors closely associated with the specimen collection, such as lack of fulfilling the rigorous criteria of correct blood drawing, use of tubes containing different additive pro-coagulants, incomplete filling or inadequate mixing of the tubes (30-32); d) temperature and time before centrifugation (33); e) lack of conformity to the recommendations regarding tourniquet time (15-17,34) are able by themselves either singularly or collectively to strongly influence many laboratory results and thereby affect the diagnostic outcome, the follow-up or even the treatment of the patients (35). The clinical laboratory results are an essential part of the healthcare delivery. It has been estimated that 60 up to 70% of medical decisions and procedures, such as drug prescriptions, assessments prior to and in the course of further investigations or dialysis, are strongly dependent upon laboratory data (36). As reported, seldom the expert phlebotomist concludes the collection of diagnostic blood specimens within sixty seconds of tourniquet application or even more (18). Several concurrent causes might contribute to lengthen the tourniquet time even over 3 minutes, such as a difficult location of an appropriate venous access, the selection of the most suited blood collection system, the insertion of the needle into the vein, the collection of many tubes, etc (3,5,6,10,15-17).
From a practical point of view, the tourniquet-induced venous stasis promotes the exit of water, diffusible ions and low molecular weight substances from the vessel thereby increasing the concentration of various blood analytes at the punctured site thus potentially influencing the laboratory results interpretation. More so, when the vascular microenvironment is subjected to both hypoxia and concurrent stasis, accumulation of some bioproducts ensues such as protons that have the potential to promote changes in laboratory parameters (37). Thus, the use of tourniquet has the potential to generate false positive results and prospectively induce the caring physicians to adopt undue treatments. On the contrary, TD is able to eliminate or greatly reduce these risks on hematological (38) and coagulation (39) laboratory tests. In order to deal with some of the above issues, the quality laboratory manager should devise and adopt improved blood collection procedures characterized by the least possible venous stasis, e.g., by implementing TDs after accurate re-evaluation of the whole blood collection procedures carried out by phlebotomists (7). Moreover studies showed that procedures related with phlebotomy have different quality performance in private and public hospitals (9) or laboratories (18) respectively. Our results showed that TD assisted phlebotomy can positively act on these health care related issues by both improving the phlebotomy procedures and promoting patient and operator safety. To better illustrate the above statements, we analyzed glucose, a molecule very soluble in water and with low molecular weight, and protein structures of different molecular weight such as albumin, total protein and alkaline phosphatase. Moreover either triglyceride levels were evaluated in order to monitor the effect of tourniquet on substances carried by large particles such as lipoprotein VLDL (very low density lipoprotein) or electrolytes with different degrees of interaction with proteins such as total calcium, magnesium, sodium, potassium and phosphate. As shown in Table 1, the concentration of glucose in the samples collected with tourniquet was significantly higher when compared to transillumination device from G2 to G4. Only in group G5 a reversal of this effect was observed and clinically significant differences were apparent. We hypothesized that glucose undergoes two simultaneous and antagonistic effects in response to venous stasis. When venous stasis had short duration, as recommended by CLSI (£ 60 sec) (12), glucose increased slightly in response to local hemoconcentration. During ischemia, as the artificial one due to prolonged tourniquet time, glucose uptake and cell glycolysis are prevalent mechanisms (40-42). When the time of tourniquet application is prolonged (G5), glycolysis dominates, thus promoting a significant reduction in the concentration of this analyte, able to affect clinical interpretation. This finding is in agreement with the study by Lippi et al. (15) who also observed a clinically significant reduction in blood glucose after 3 minutes of tourniquet application. High molecular weight molecules like proteins, represented in our study by albumin, total protein and alkaline phosphatase showed the expected performance (increased concentration, proportionally to the venous stasis time). All of these biomarkers increased significantly and progressively among G2 to G5 in samples obtained using tourniquet. Starting from G2, the clinical significance for total protein and albumin appears different. Alkaline phosphatase shows similar change only in G5. The above divergence could be explained by the higher biological variability of alkaline phosphatase in respect of total protein and albumin, which produces a large variation in results. Our results are comparable with those of Lippi et al. (15) for albumin and the behavior of ALT enzyme studied by these authors is similar to our data on alkaline phosphatase. Similar studies have shown that plasma fibrinogen (39), and hemoglobin (38) concentration in whole blood had a similar response, such as that observed for total protein and albumin.
Serum levels of triglycerides, showed a progressive and significant increase with increasing time of tourniquet from G2 to G4; this is the expected behavior for a molecule associated mainly with a large particle of VLDL. The high biological variability of this analyte (CVw 28.2%) (43) may explain the absence of clinically significant changes in these groups.
Unexpectedly, in the G5 triglyceride concentration significantly was reduced in samples subjected to prolonged venous stasis with a clinically significant effect. Our hypothesis is that the complex milieu created by prolonged venous stasis, hypoxia and acidosis was able to stimulate the rapid degradation of triglycerides that were mobilized to provide energy to the tissue in response to reduced synthesis of ATP from glucose oxidation. Studies of serum triglycerides in response to moderate hypoxia ischemia point to the same direction (44,45).
For total cholesterol, transported in plasma mainly by LDL, a particle significantly smaller than VLDL, Lippi et al. (15) observed a significant increase only after 3 minutes of tourniquet.
The cations, calcium and magnesium, are strongly associated with proteins, which may explain the trend to increase during tourniquet application similar to total protein and albumin, and clinically significant from G2 to G5. The behavior of calcium observed is similar to that described by Lippi et al. (15) for tourniquet time application during 60 sec and 180 sec. The behavior of serum sodium and potassium compared to venous stasis observed in this study diverged from the report by Lippi et al. (15). We suggest that the increase of potassium due to venous stasis is related to local acidosis resulting from this process, the proton being internalized into the cell and replaced by potassium, which would increase its plasma levels (37). Among the parameters that presented the highest stability against venous stasis was the serum phosphate concentration. Only after three minutes tourniquet were elevated concentrations of phosphate identified. There is not a causal explanation at present for the performance of this analyte. Some of the above effects of venous stasis appear controversial among different studies. Moreover the performance and coefficients of analytical variation of different analytical instrument can differently influence the variability of parameters such as triglycerides that appear responsible for the above differences observed between our study and Lippi et al. (15).
On the other hand it is clear the effect of tourniquet on laboratory parameters with different structural characteristics and physico-chemical properties. The possibility of eliminating this source of variation through location of veins by transilluminator device shows the potential to eliminate this source of error. In summary, our results show that venous stasis created by the use of tourniquet affects routine tests and that transilluminator device handling can be an effective method to eliminate this source of preanalytical variation.
The above results do obviously apply only to our experimental design, even though they could represent a viable basis for the governance of the preanalytical variability related to sample stasis. Further studies are needed in order to validate the use of TD as for possible aid in reducing the haemolytic specimens. Moreover an evaluation of TD use in patients with clinical conditions able to affect vein access should be devised.
No potential conflicts of interest relevant to this article were reported.
Acknowledgements
We are grateful to: Mrs. Nadia Keder Assan for her dedication to collect all diagnostic blood specimens for clinical chemistry tests; Mrs. Regina Krybus Product Specialist from Ortho Clinical Diagnosis - Johnson & Johnson Medical Brazil for supporting with reagents and technical assistance; Mrs. Adriana Caschera Leme Faulhaber Tecnichal Coordinator of Clinical Chemistry section in Clinical Pathology Department of the Hospital Israelita Albert Einstein, Sao Paulo, Brazil and her work group for help in performing laboratory tests.